I am unable to use a range for the color map scale which spans from negative to positive values. Even though the values in the transfer function are correct, the scale keeps showing just the positive values starting from 0. Can you help me to fix this?
ParaView should be able to handle negative values just fine. Do you have “Use log scale when mapping data to colors” on by chance? In that case, the scale will indeed be adjusted to only positive values.
If that’s not it, could you post a screen shot with what you are seeing?
I’m not at my computer right now to test this, but I notice that you are viewing the magnitude of a vector. The magnitude of a vector can never drop below zero, so ParaView may be “helpfully” clamping the minimum value to 0. If you choose something that can be negative, such as the X value of the vector, I bet you will be able to set negative values.
Is there any particular reason why you want the color scale to go below zero on data that cannot go below zero?
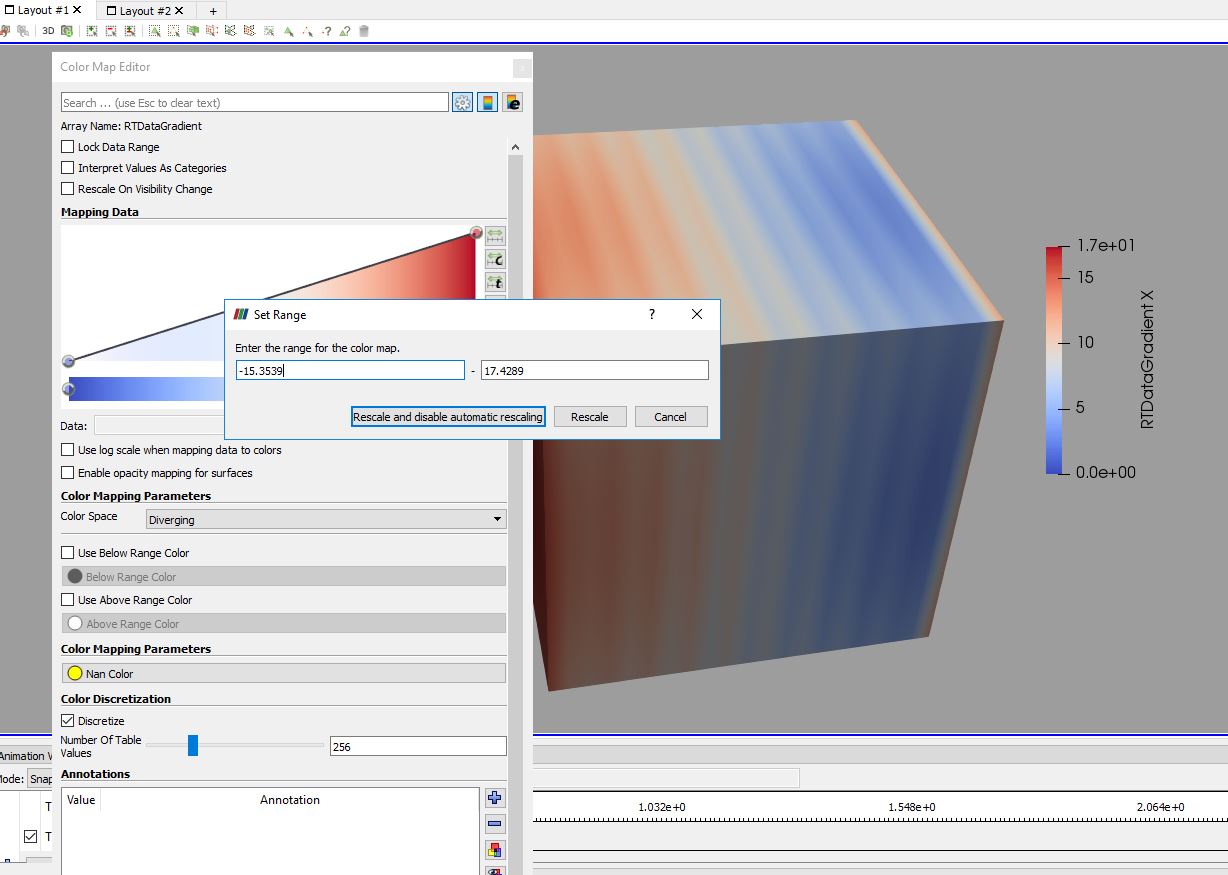
However, even plotting the Y vector component, it still does not work. I attached another screenshot. I have tried also plotting other vectors components (if I check the spreadsheet view they all have both negative and positive values) but the scale always starts from 0.
I am using Paraview version 5.4.1.
Looking at this, I see that sometimes the data values and colors table can be out of sync with the range of the color map. You can toggle the advanced settings to hide and then show the color map values table again to update the values.
Another way to check the currently set color map range, click on the tool bar button . It will show the currently set color map range.
How are you trying to change the scale of the colors? Are you trying to put in negative values into the color map spreadsheet? ParaView generally does not let you do that. The correct way is to click one of the rescale time range buttons. The Rescale to custom range button should let you do what you want.
I can reproduce the zero at the bottom of the color scale, but only when I turn “Use log scale…” on then off again, then click on the “Reset to data range” button. This is a bug, of course, and I fixed it in ParaView 5.6. Can you upgrade to that version?
Even if you aren’t toggling log scaling, the bug fix in 5.6 may also fix your issue as well.
Apparently with the old version when I open Paraview I can see that the log scaling is already on like I set that as default property for scaling, so then when I turn it off and try to set a custom range it presents that issue.
Anyway I am glad it is sorted!