Hi,
I have a writer that writes EFDC model data out to a NetCDF file following the UGRID convention.
I can open this file with the UGRID reader in ParaView 5.12.0.
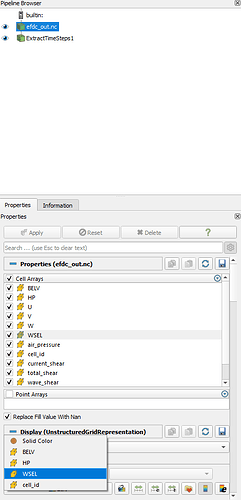
The “Cell Arrays” also list all the variables I have in the file.
However, the “Coloring” option only shows a few variables I have. (BELV: Bed elevation, HP: Water Depth, WSEL: Water surface elevation, cell_id: cell id)
I know some variables I have that include multiple vertical layer results might not yet supported by ParaView (i.e: ‘U’, ‘V’, ‘W’…).
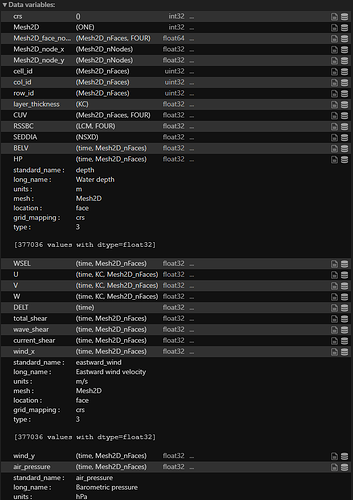
But variables like ‘wind_x’ and ‘wind_y’ (eastward, northward wind) have the same array dimension as ‘BELV’, ‘HP’, and ‘WSEL’, which are not shown in the coloring option either.
I was expecting at least I could see animation of each cell value changing over time for arrays having the same dimension.
But so far I can only do that for ‘BELV’, ‘HP’ and ‘WSEL’.
Did I do something wrong when writing out my NetCDF UGRID file?
I would also like to know how many dimensions the current ParaView NetCDF UGRID reader can read in for ParaView to display.
For example, ParaView can read and display a 2D plane result that changes over time.
But what about data with additional z-dimension?
Or even more dimensions representing different classes of simulated substance?
Are there other alternative paths you recommend so ParaView can display them?
Here is a screenshot showing ParaView recognizes all available variables, but the coloring option only shows a few.
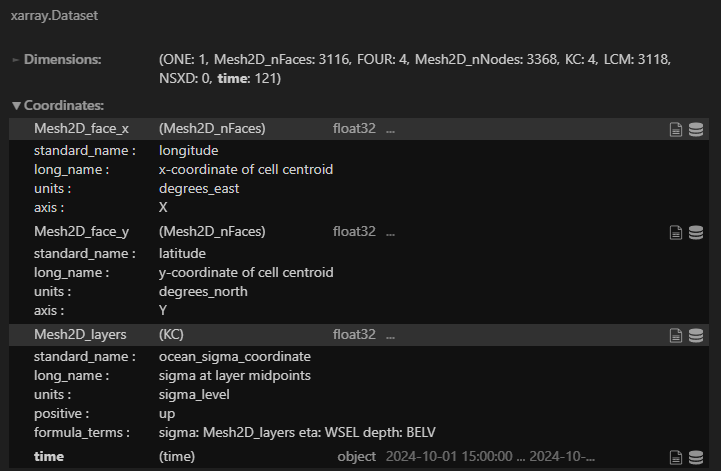
The screenshots below are information about this file. I’m using Python xarray to read it.
Here is the link to download the NetCDF file.
https://www.dropbox.com/t/zc97FdwA1gs5diHM
Thank you.


