No difference between surface and points representations

Hello there!

I have been trying to plot bathymetric and topographic data alongside an ocean free surface.

I managed to make an overall good animation, but I keep getting those holes in the landscape. When I zoom in, it seems that the surface view doesn’t work, or that I don’t know how to use it. When I select points, the rendering is exactly the same.

Also, in the end I’d like to do something like this How to make 2D data look like more realistic in 3D view? .

I tried the solutions explained in the post, I tried Delauney3D, I tried extract surface, which doesn’t make sense as I don’t have any surface yet.

My datasets are too big, so here is one in which I have the same problems, even if playing with points size with this data kind of avoids the problem. I’ll upload my datasets in comments.

Update: There is an error when I’m uploading the little dataset.

Merci :))

Here are some of the files I’ve been using. Bathy for the bathymetry and topography and H_n for the water free surface height at n time.

Hi Iban
Your data is point-data, so Extract Surface only extracts points (and you end up with the input). What you need is to generate the surface from the points, e.g. a means of telling ParaView how the points are connected. I am not sure how to do this with your data in ParaView - someone else needs to answer this. But maybe you have the possibility to save your data in a grid format (the points look like they are already positioned on a grid, so you probably don’t even have to interpolate)? E.g. a netcdf grid would easily load as a surface and would save memory, too.
Cheers,
Venke

Hi Venke

We thought about implementing NetCDF format as output of our models, but hadn’t really the reason to do so yet. I guess we now have a reason. I’ll try to do that even if I don’t know yet, could be useful later anyway. And yes, it is supposed to be some kind of grid, but I was learning how to use paraview so I took first format that worked.

Thanks Venke ! But I won’t close the topic because I’m really interested in why it doesn’t work, and why triangulation doesn’t work also, if anyone has an answer?

Iban

Hej Iban,
I just saw this post: mapping scalar data to unstructured mesh which could be used if you want to visualize the .txt files as surfaces (well, as long as nobody has a smarter answer to this…):
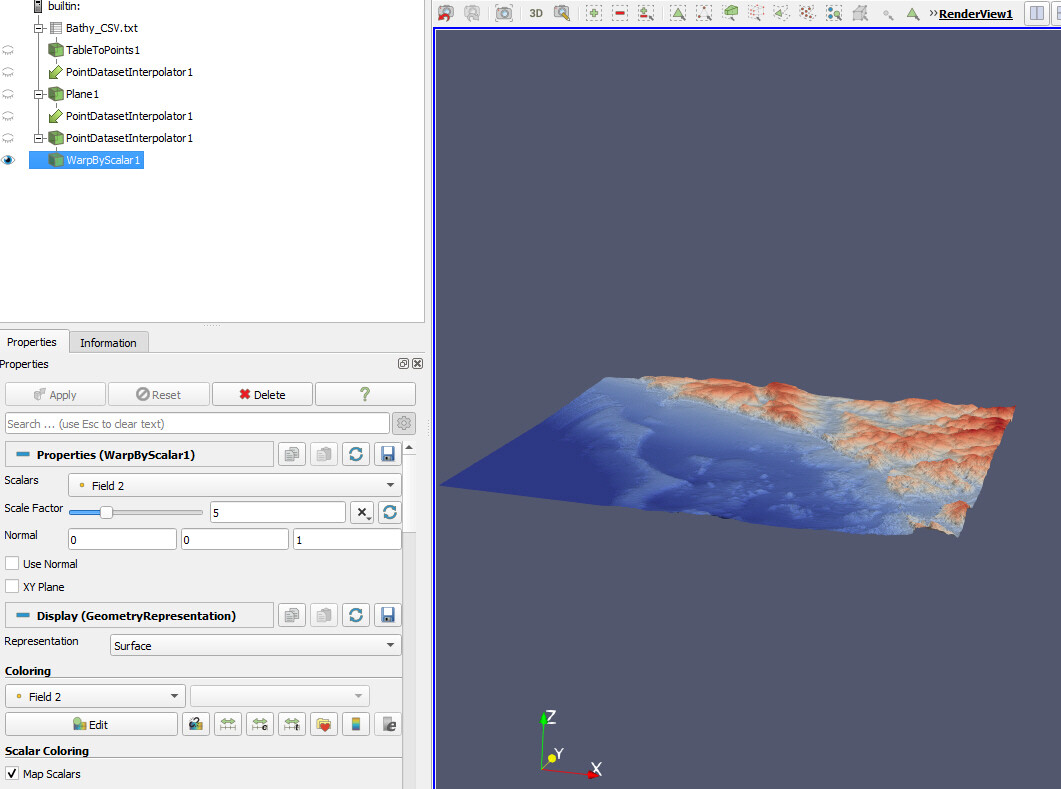
With TableToPoints applied to the input data and a plane source positioned at the same grid location, you can use the PointDatasetInterpolator to map the point data to the plane. After that you can use the WarpByScalar filter to produce the elevation from Field 2.
(I used a vertical exaggeration of 5 in the plot.)
Cheers,
Venke

It works quite well! Even if it needs some time for computing everything, that’s a really smart turnaround. Too much precision when creating the plane source made Paraview literally crashed and close itself.

I also smoothed the surface with the smooth filter because it looked like cube world otherwise.

It took 4h to make a 85 frame jpeg animation :sweat_smile: