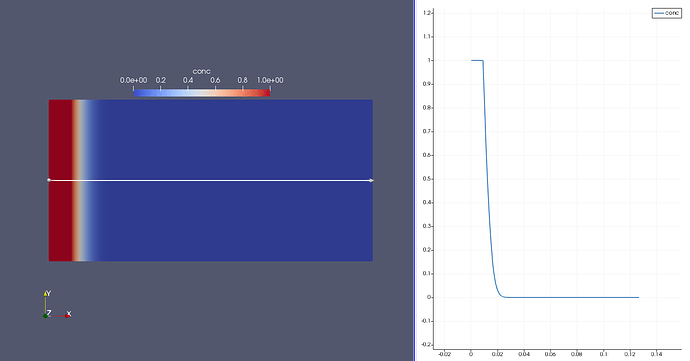
I have a very steep concentration profile near a moving boundary for which i am using fine grid resolution. While plotting this profile using plot over a line feature of paraview, I am getting the values of field interpolated on points lying on this high resolution line source. My question is how to create a line source with non-uniformly spaced points on this line source. Right now the turnaround is to use a lot of points on the line source.
You can use the Python programmable filter to generate a new vtkPolyData with the line that has point locations placed to your choosing. The ParaView guide has an example of a Helix Source in section 13.2.5 which may help. Then use the Resample With Dataset filter to probe using your custom source instead of standard line. Next, apply Plot Data filter and you should be able to plot the results.
Thanks Utkarsh. Could you help me with a link to Paraview Guide. I found this on the website but it seems it is only available as print version.
Oops… sorry I found it. Thanks once again.
Here’s another idea if you just want sample points where a line intersects your grid. Your data looks like a 2D plane, so you could Slice it with a plane perpendicular to your simulation domain. The resulting slice will be a polyline with points at the cell boundaries. You can use that polyline as the custom source in the Resample With Dataset.
Thanks Cory for that alternative idea which looks intuitive as well.
Well after I apply Resample with Dataset with the Slice as custome source, how to I get the line plot. Do I again need to apply the “Plot Over Line”. I suppose that would again use a high resolution line source over the “Resampled with Dataset” pipeline.
P.S. I have my data writtten as cell data, since it emanates from structured quadtree based AMR technique.
Okay, I think I have got it. So i shouldnt apply the “Plot Over a Line” and instead I should render the
“Resample with Dataset” in the Line Chart View. Since my data set is a cell based dataset arising out of AMR (quadtree) grid I see a stepped profile in the line chart which makes sense since now the data is being sampled at the grid intersections with the slice which will be seen as one constant value across the cell. To circumvent this I apply Cell Data to Point Data filter and then apply Slice followed by Resample With Dataset which then gives me a smooth profile. Is there some caveat which I am missing or is this the way to go ?
Thanks, Aniruddha
That seems reasonable if you want to get a smooth profile, but if the steps showing the cell data are acceptable I might go with that since it shows the raw data values. Up to you, of course.
