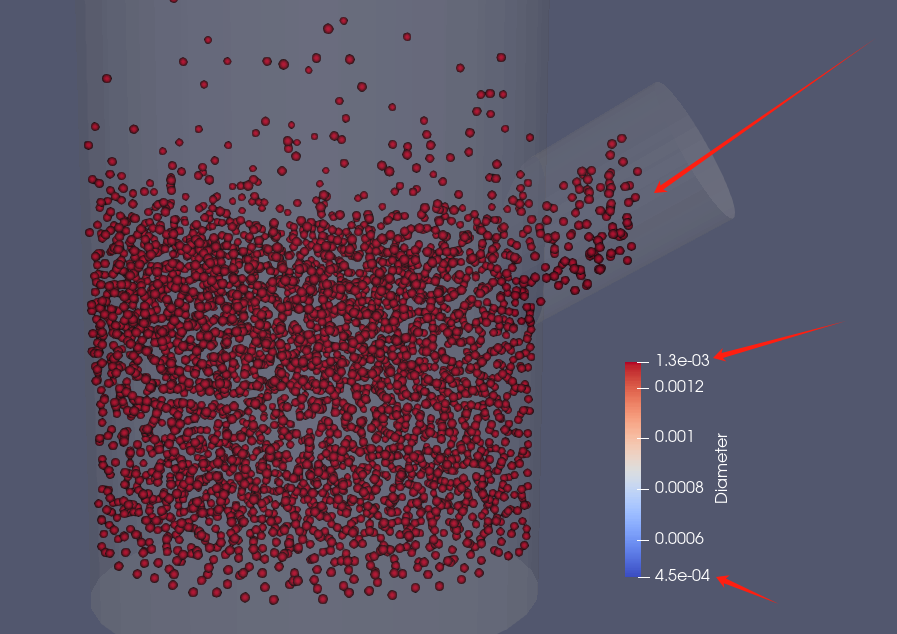
Hello researcher, I am using the CFD-DEM method to simulate gas-solid two-phase flow. In the simulation, I set up two particles with different diameters, but during post-processing, I found that particles with different diameters display the same color. Is there any method to make particles with different diameters display different colors?
I suppose its a temporal data? I think it’s probably an issue with your colormap which is not correctly rescale. You may want to rescale your colormap depending on all timesteps thanks to this button in paraview Rescale to data range over all timesteps :
You can also do something similar in the ColorMap Editor (in View / ColorMap Editor) with the Automatic Rescale Range Mode to Grow and update every timestep.
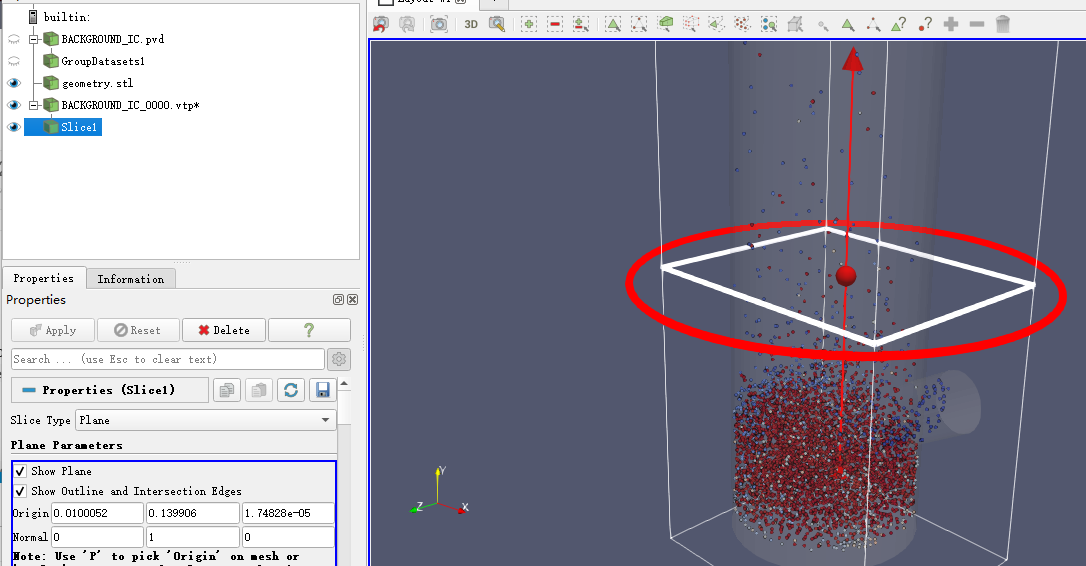
Thank you for your prompt reply. Another issue is that I want to monitor the gas flow rate on a section. I used the section function, but the section operation on a cylinder was not successful. This is because when I cancel the show plane function, I cannot see the cut surface on the cylinder. Which file type should I use for the section? The cross-section shown in the figure is carried out in a. vtp file.
currently, based on your pipeline, you do the section on the particule not the cylinder that’s why you will see nothing (except if a particule is in the section of your slice), here is what I have when I apply it on the geometry.stl :
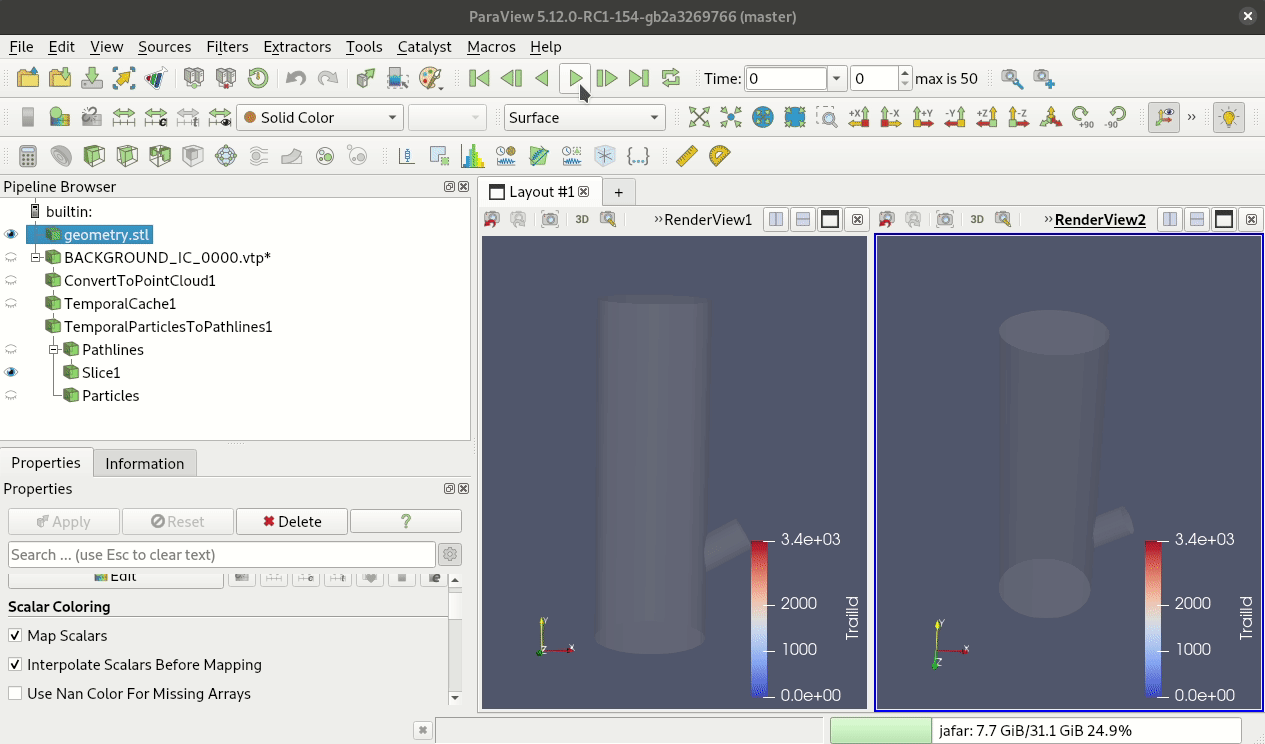
Thank you for your prompt reply. Excuse me again, I would like to solve for the mass flow rate of gas on the cross-section just now. Can you provide some help? Sincerely seeking your help, thank you very much! Case.zip (2.7 MB)
Sadly, I don’t really know how you can compute this information in ParaView maybe other people can help you. In term of visualization, you can apply a slice on the output of Temporal Particules to PathLine like this:
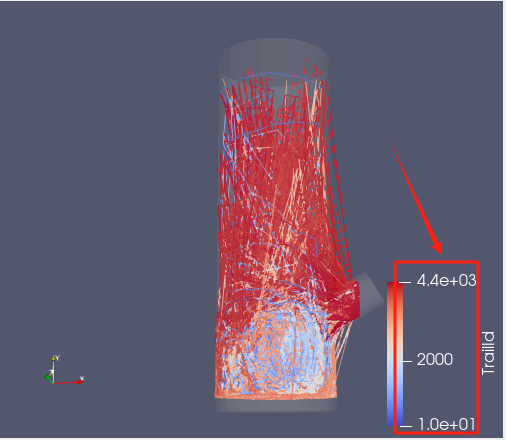
Maybe you can do some post treatment with the TrailId? (to not count duplicate trail)
TrailID represents the id for each trail, so using it as colormap is probably not really relevant for you.
This filter Temporal Particules To Pathline has a parameter Mask Points if you set it to 1, you’ll have 1 trail per particule (if you set it to 10 you will have 1 trail for each 10 particules, …)
Do you think using this filter + a slice can help you for your use case?
Thank you very much for your reply. Your answer is not helpful for my question, but it has taught me new knowledge. I have already posted relevant questions on the forum. Anyway, thank you again.