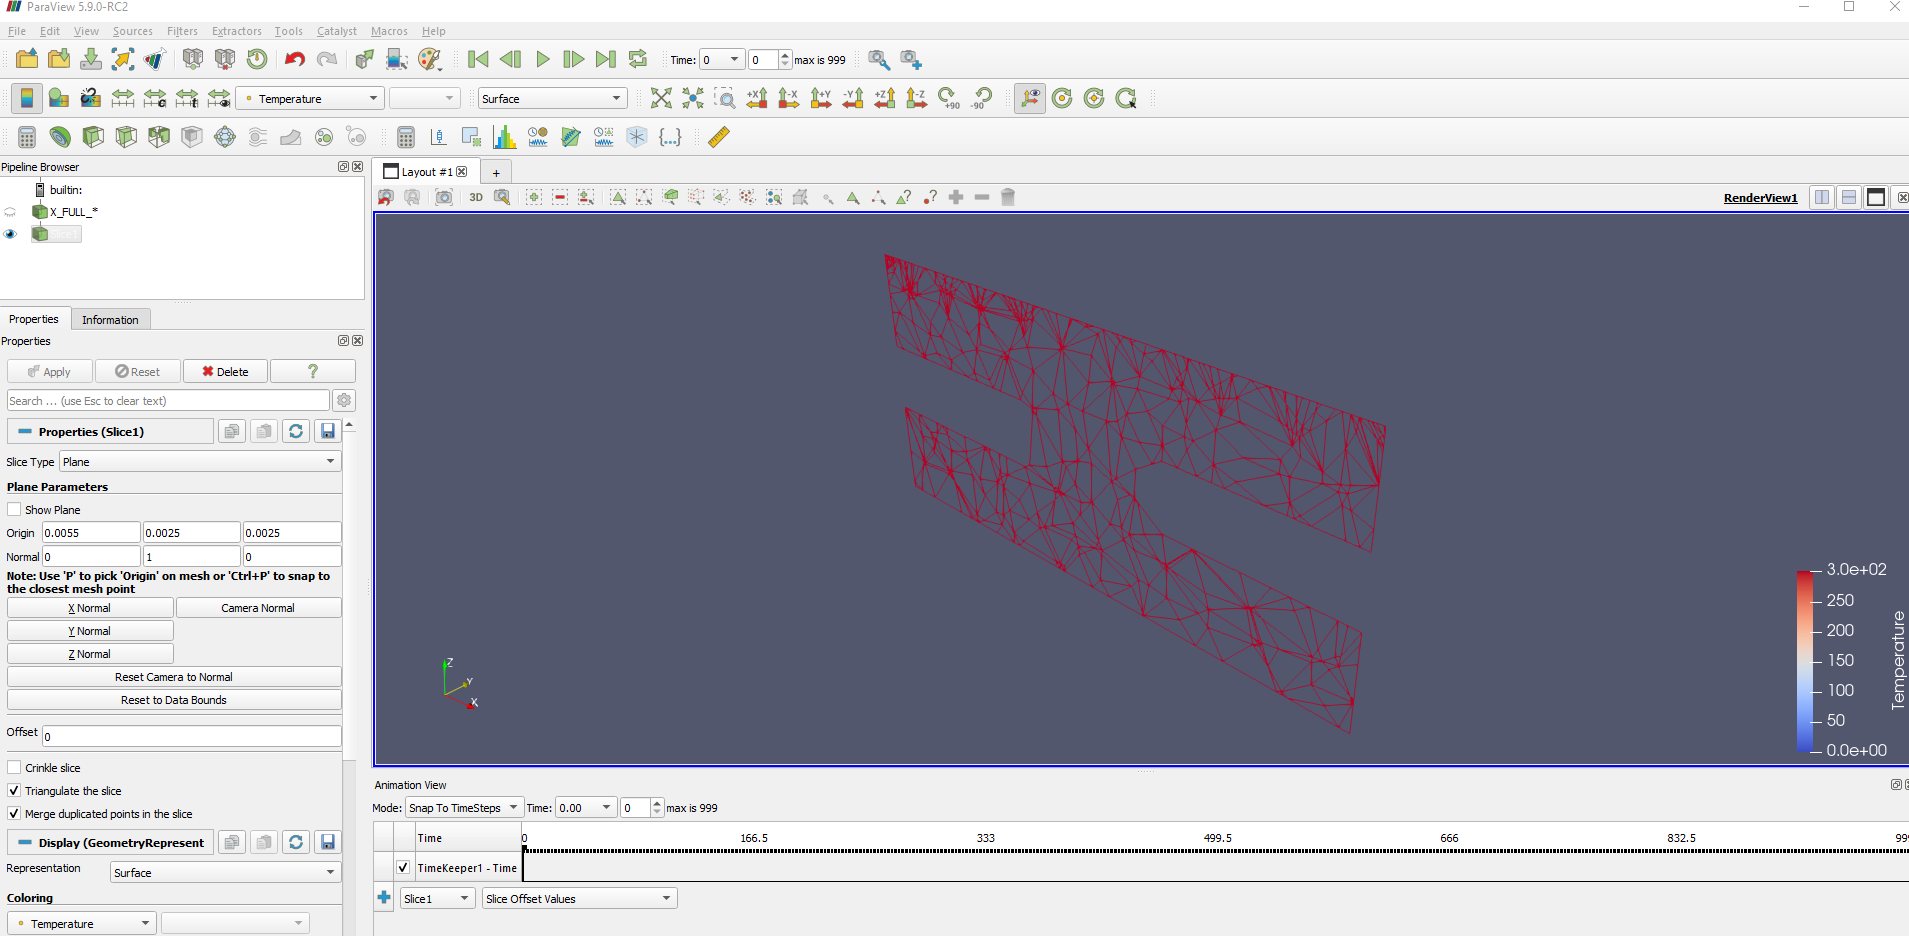
I am having an issue with Paraview 5.9.0-RC2. I am trying to visualize a dataset with several slice filters. However, whenever I implement the filter, the representations “Surface,” “Surface with edges,” and “Wireframe” all display the same result: a wireframe of the slice. I have attached a .png image of this phenomenon at the bottom of this message. Ideally, the “Surface” representation would return a solid plane, with coloring generated from an interpolation of the wireframe. The data set, X_FULL, is stored as a sequence of .vtk files, and was generated using matlab. A sample .vtk file is attached with this message. Is there something obvious that I’m missing, in terms of working with the ParaView GUI or with formatting the .vtk files? If not, what would be the most efficient way to diagnose the cause of this issue? My thanks for any advice you can provide!
X_FULL_8.vtk (332.6 KB)