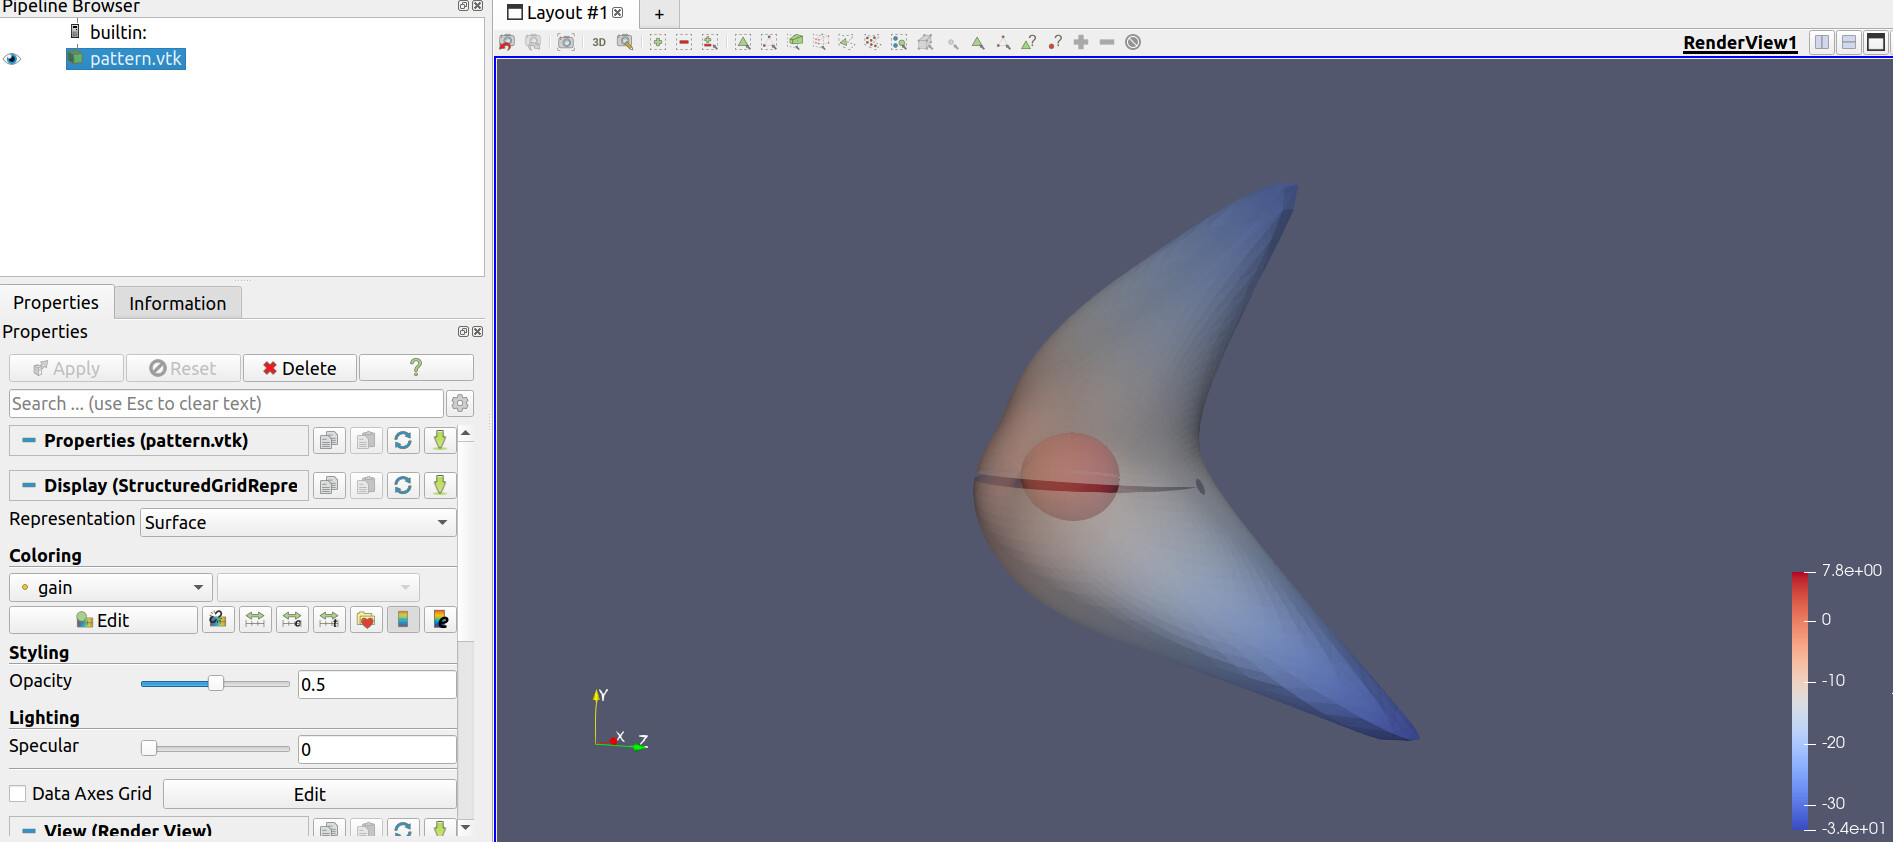
However, if I convert the values to dB (i.e. use log when exporting to VTK), a lot of values will be negative. For some reason, ParaView does not seem to like this, and gives a very different shape:
Why is that? Is there a way to help ParaView properly parse the shape I want, and not struggle with negative values? Could I change something in the VTK files?
@mwestphal Thanks for your input! Notice anything obvious that would fail the (r, θ, φ) → (x, y, z) conversion for negative r values (farfield) only?
def DumpFF2VTK(filename, farfield, thetaRange, phiRange, scale=1):
    try:
        os.remove(filename)
    except OSError:
        pass

    t = thetaRange*math.pi/180
    a = phiRange*math.pi/180

    with open(filename, "w+") as fid:
        fid.write("# vtk DataFile Version 3.0\n")
        fid.write("Structured Grid by matlab-interface of openEMS\n")
        fid.write("ASCII\n")
        fid.write("DATASET STRUCTURED_GRID\n")
        fid.write("DIMENSIONS 1 "+str(int(len(t)))+" "+str(int(len(a)))+"\n")
        fid.write("POINTS "+str(int(len(t)*len(a)))+" double\n")


        for na in range(len(phiRange)):
            for nt in range(len(thetaRange)):
                fid.write(str("{:e}".format(scale*farfield[nt,na]*sin(t[nt])*cos(a[na])))+" "+str("{:e}".format(scale*farfield[nt,na]*sin(t[nt])*sin(a[na])))+" "+str("{:e}".format(scale*farfield[nt,na]*cos(t[nt])))+"\n")

        fid.write("\n\n")
        fid.write("POINT_DATA "+str(int(len(t)*len(a)))+"\n")
        fid.write("SCALARS gain double 1\nLOOKUP_TABLE default\n")

        dumpField = farfield.flatten("F")

        for i in dumpField:
            fid.write(str("{:e}".format(i))+"\n")
Aha, looks like I got it. This fixed it - I basically add the absolute value of the minimum value of r to the r array conversion calculator, and now everything looks ok:
        for na in range(len(phiRange)):
            for nt in range(len(thetaRange)):
                fid.write(str("{:e}".format(
                    (abs(np.min(farfield))+farfield[nt,na])*sin(t[nt])*cos(a[na])))+" "+
                    str("{:e}".format((abs(np.min(farfield))+farfield[nt,na])*sin(t[nt])*sin(a[na])))+" "+
                    str("{:e}".format((abs(np.min(farfield))+farfield[nt,na])*cos(t[nt])))+"\n"
                )
@mwestphal Follow-up question:
I currently write SCALARS gain double 1 to the VTK file, and the colorbar displays that. Is it possible to include space characters in the name, like so?