Hi
maybe you can help me out with a right comment or hint for my problem.
Pretty easy, I would like to plot a 2D slice vtp file (OpenFOAM) via matplotlib as tricontourf plot.
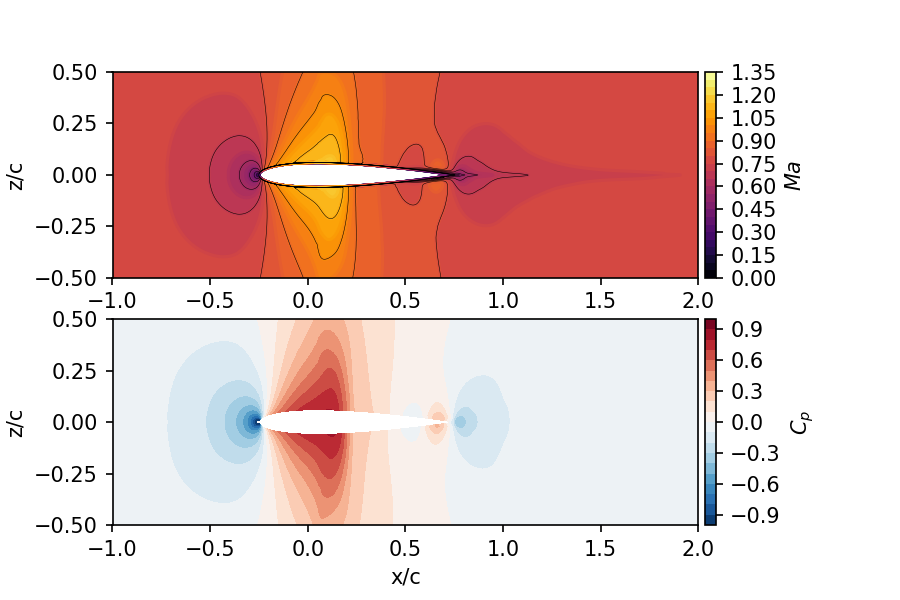
1.) Creating the vtp slice by Paraview and saving as vtp file works like a charme
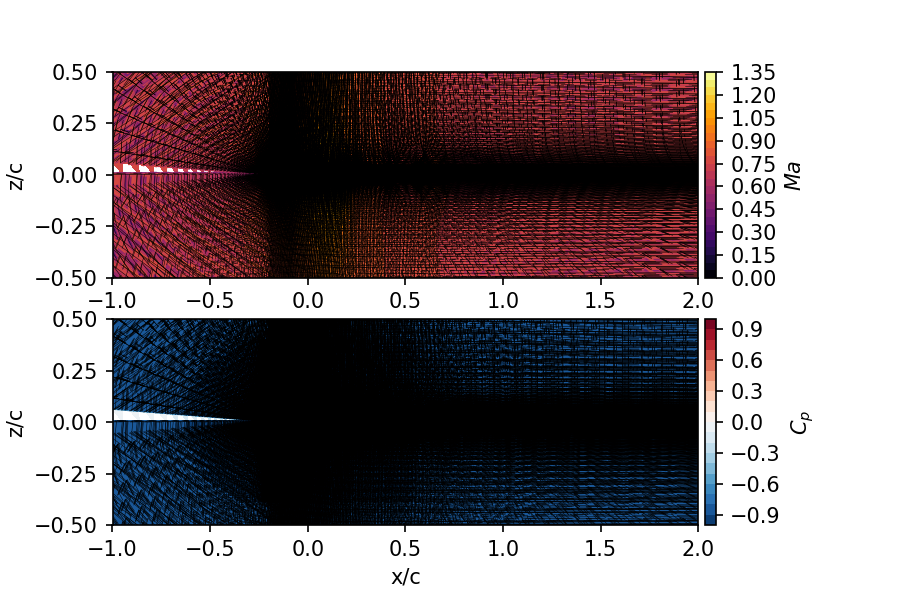
2.) Using the runtime vtp file, created by cuttingPlane - libsampling OpenFOAM creates a weird triangle order.
In the attachement you can find an example, including the plotting python script and the data loader.
What am I missing?
Best,
def loadVTPFile(filename):
    import vtk
    from vtk.util.numpy_support import vtk_to_numpy
    from vtk.util import numpy_support as npvtk

    reader = vtk.vtkXMLPolyDataReader()
    reader.SetFileName(filename)
    reader.Update()
    data = reader.GetOutput()

    points = data.GetPoints()
    npts = points.GetNumberOfPoints()
    x = vtk_to_numpy(points.GetData())


    triangles=  vtk_to_numpy(data.GetPolys().GetData())
    ntri = triangles.size // 4  # number of cells
    tri = np.take(triangles,[n for n in range(triangles.size) if n%4 != 0]).reshape(ntri,3)

    n_arrays = reader.GetNumberOfPointArrays()
    for i in range(n_arrays):
        print(reader.GetPointArrayName(i))

    X = vtk_to_numpy(points.GetData())
    x=X[:,0]
    y=X[:,1]
    z=X[:,2]

    # Define the velocity components U=(u,v,w)
    U = vtk_to_numpy(data.GetPointData().GetArray('UMean'))
    u = U[:,0]
    v = U[:,1]
    w = U[:,2]
    magU=np.sqrt(u**2+v**2+w**2)

    p = vtk_to_numpy(data.GetPointData().GetArray('pMean'))
    Ma = vtk_to_numpy(data.GetPointData().GetArray('MaMean'))
    rho = vtk_to_numpy(data.GetPointData().GetArray('rhoMean'))


    return x,y,z,u,v,w,magU,p,Ma,rho,tri