Hello everyone
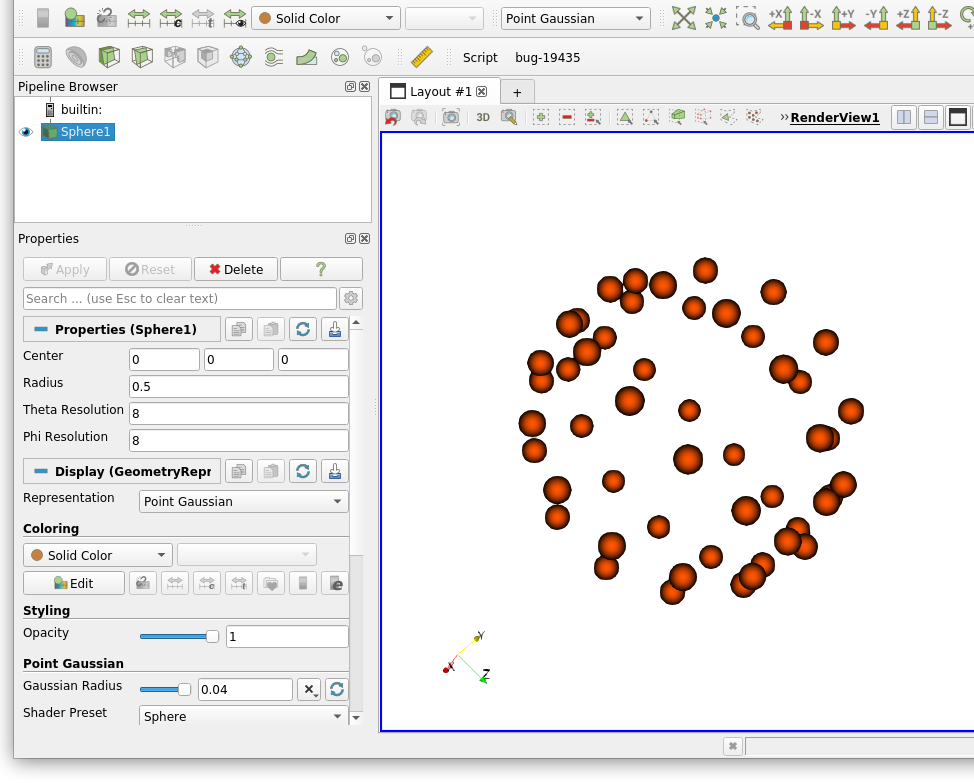
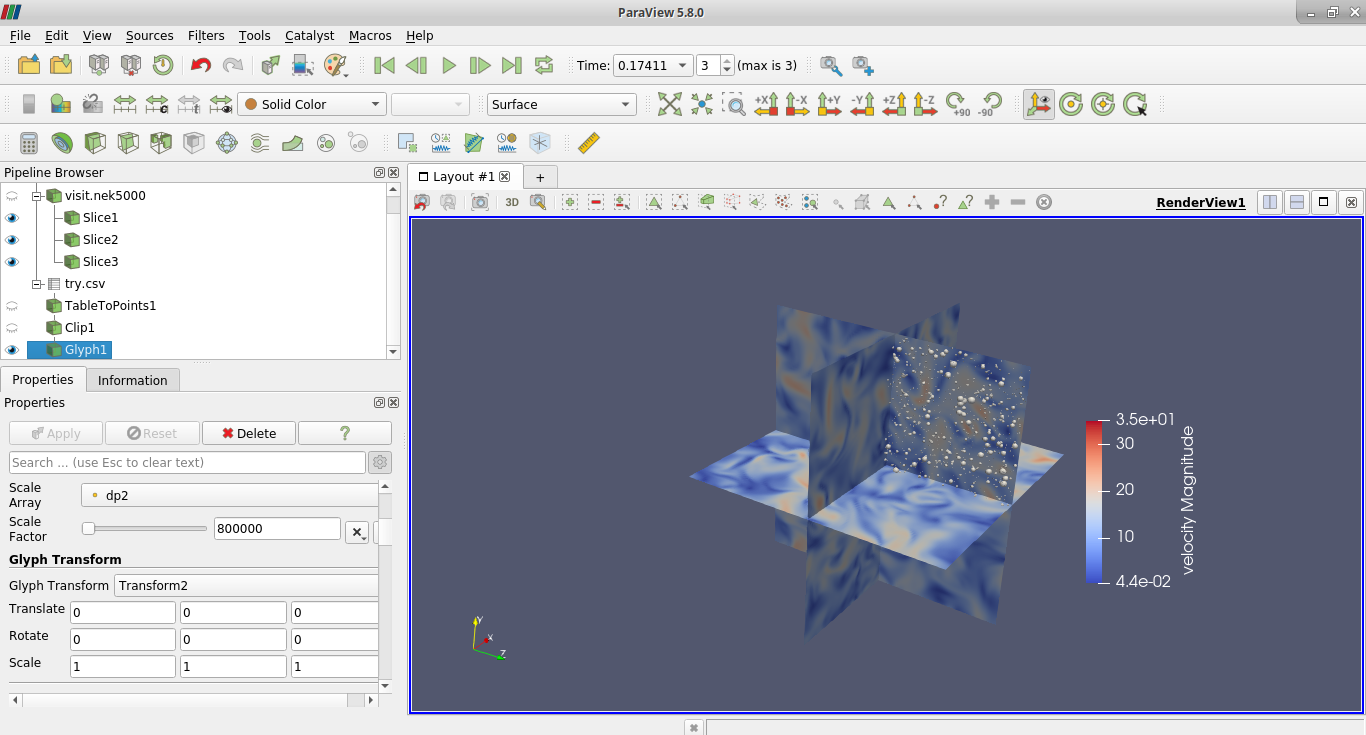
I have collected the data of particles’ positions and their diameters in a .csv file. Later, I read them into Paraview 5.8.0 using TableToPoints filter, select the Keep all Data arrays option and choose X, Y, Z column options as the particles’ positions. After clipping them to a certain domain, I attempt to plot these particles as glyphs with Sphere being the Glyph type. In the Scale option, I select the particles’ diameters as the Scale array and choose a suitable Scale factor as the particles are too small to be visible.
By default, the Masking option shows the following parameters:
Glyph mode : Uniform spatial distribution (bounds based)
Maximum number of sample points : 5000
Seed : 10339
My main concern is that when I change the maximum number of sample points to say 1000 or 100000, the particle glyphs appearing in the screen appear/disappear accordingly. In my opinion, this must not happen because the number of particles is fixed (input via the .csv file). So, I wanted to know if I am missing something or I need to adopt an alternative procedure to visualize the particles in Paraview.
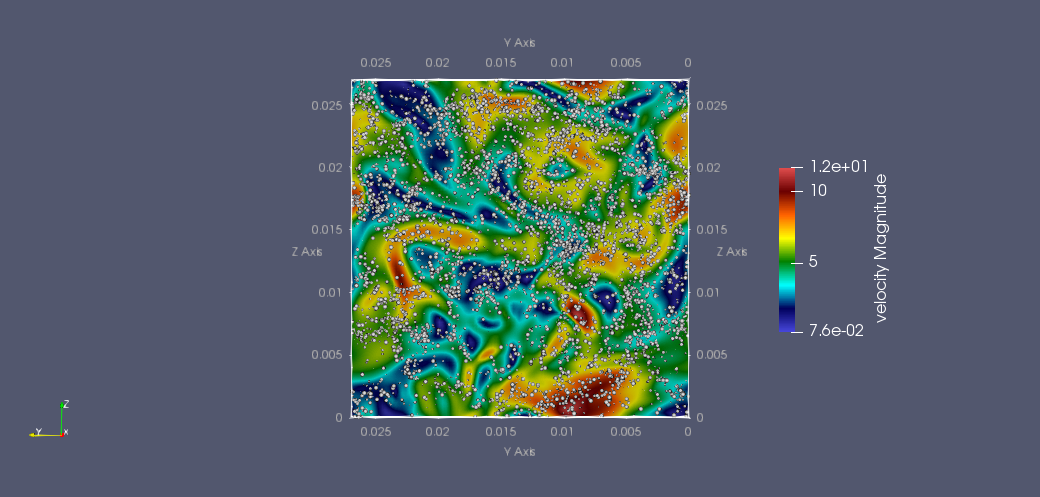
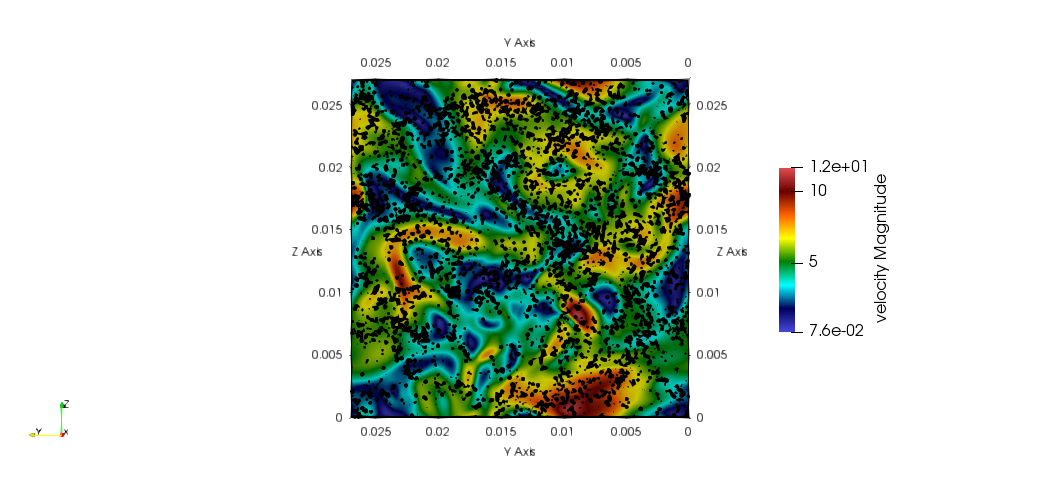
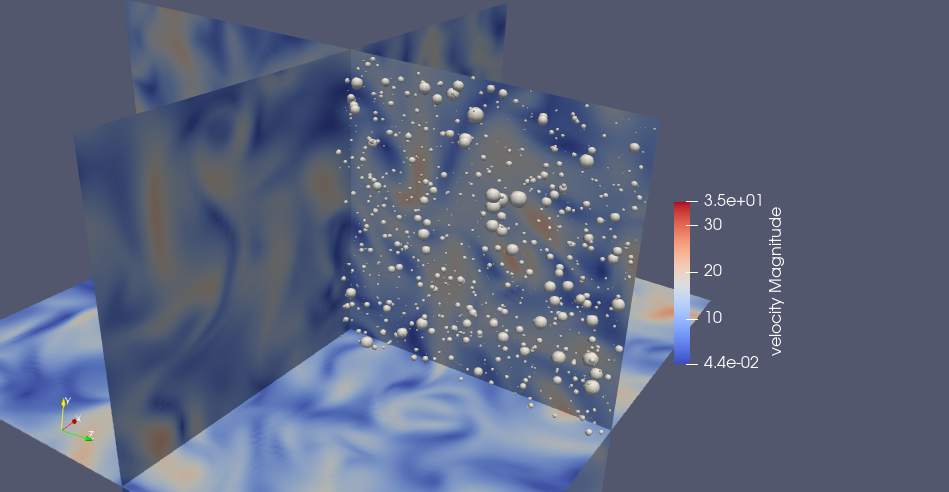
Paraview screen below (the white points are particles as glyphs) :
Zoomed below :
For reference, the paraview state and .csv files are available in this link
Thanks
Sthavishtha