ValeRomano
November 2, 2020, 5:07pm
1
Hi,
Thank you,
mwestphal
November 4, 2020, 8:33am
2
ForceTime filter ?
If you can read your data in ParaView, you can process it as any other format.
ValeRomano
November 4, 2020, 8:41am
3
Hi Mathieu,
Plot point over time
Edit → Reset Session.
Open can.exo. Turn on all data. Apply .
Drag the can around with the left mouse button until you can see the can.
We want to plot a point over time. First, we need to select a point.
Click on Select Points On icon. Then, click on a point on the can.
Filters→Data Analysis→Plot Point Over Time . Apply.
Display tab, unselect everything other than DISPL (Magnitude)
You now have a plot of the displacement. at your point.
Extra Credit – Using Select Cells On icon, and the Plot Cell Over Time , plot EQPS over time.
Thank you,
mwestphal
November 4, 2020, 2:22pm
4
Plot over time should work.
Could you share your data ?
ValeRomano
November 4, 2020, 4:34pm
5
Hi Mathew,
Thank you for your help,
mwestphal
November 6, 2020, 11:30am
6
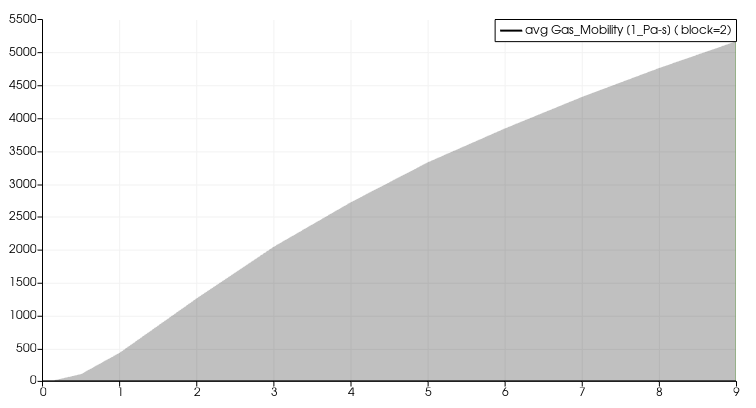
Plot data over time works with your dataset:
ValeRomano
November 6, 2020, 11:43am
7
Hi Mathieu,
Thanks a lot,
Valentina Romano, PhD