ParaView
Plot a simple XY chart
ParaView Support
mwestphal
(Mathieu Westphal (Kitware))
January 25, 2019, 8:47am
2
The simple way to go is with a
csv
file.
Open ParaView
Open your csv file
Set separator to " "
Apply
Create a new view, Line Chart View
Show your file in the view
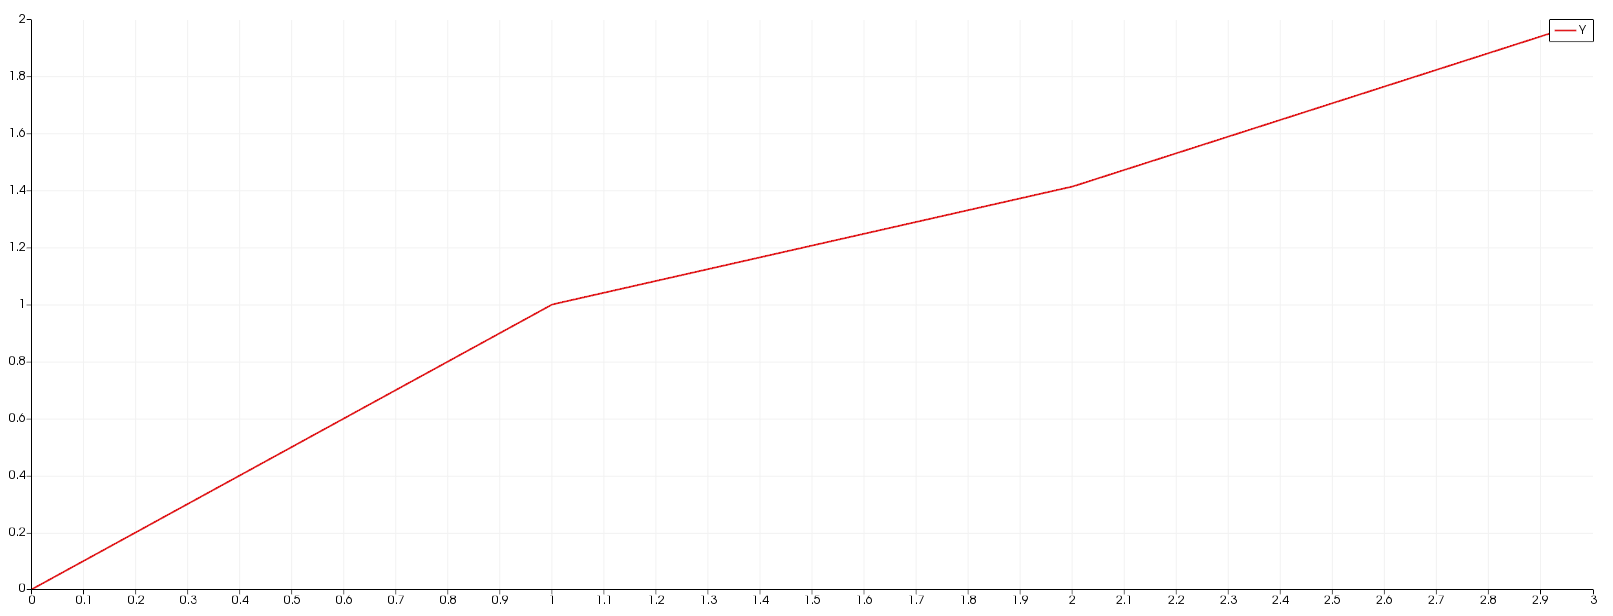
In Series Parameters, check “Y”
a.png
1613×616 10.2 KB
2 Likes
show post in topic