Hey,
i would like to plot data over time, it shall be represented the increasing height of an alphaphase.
In this Thread Cory showed me, how to set up a python annotation to mesaure the hight.
Is it possbile to show the course of the increase in a plot ?
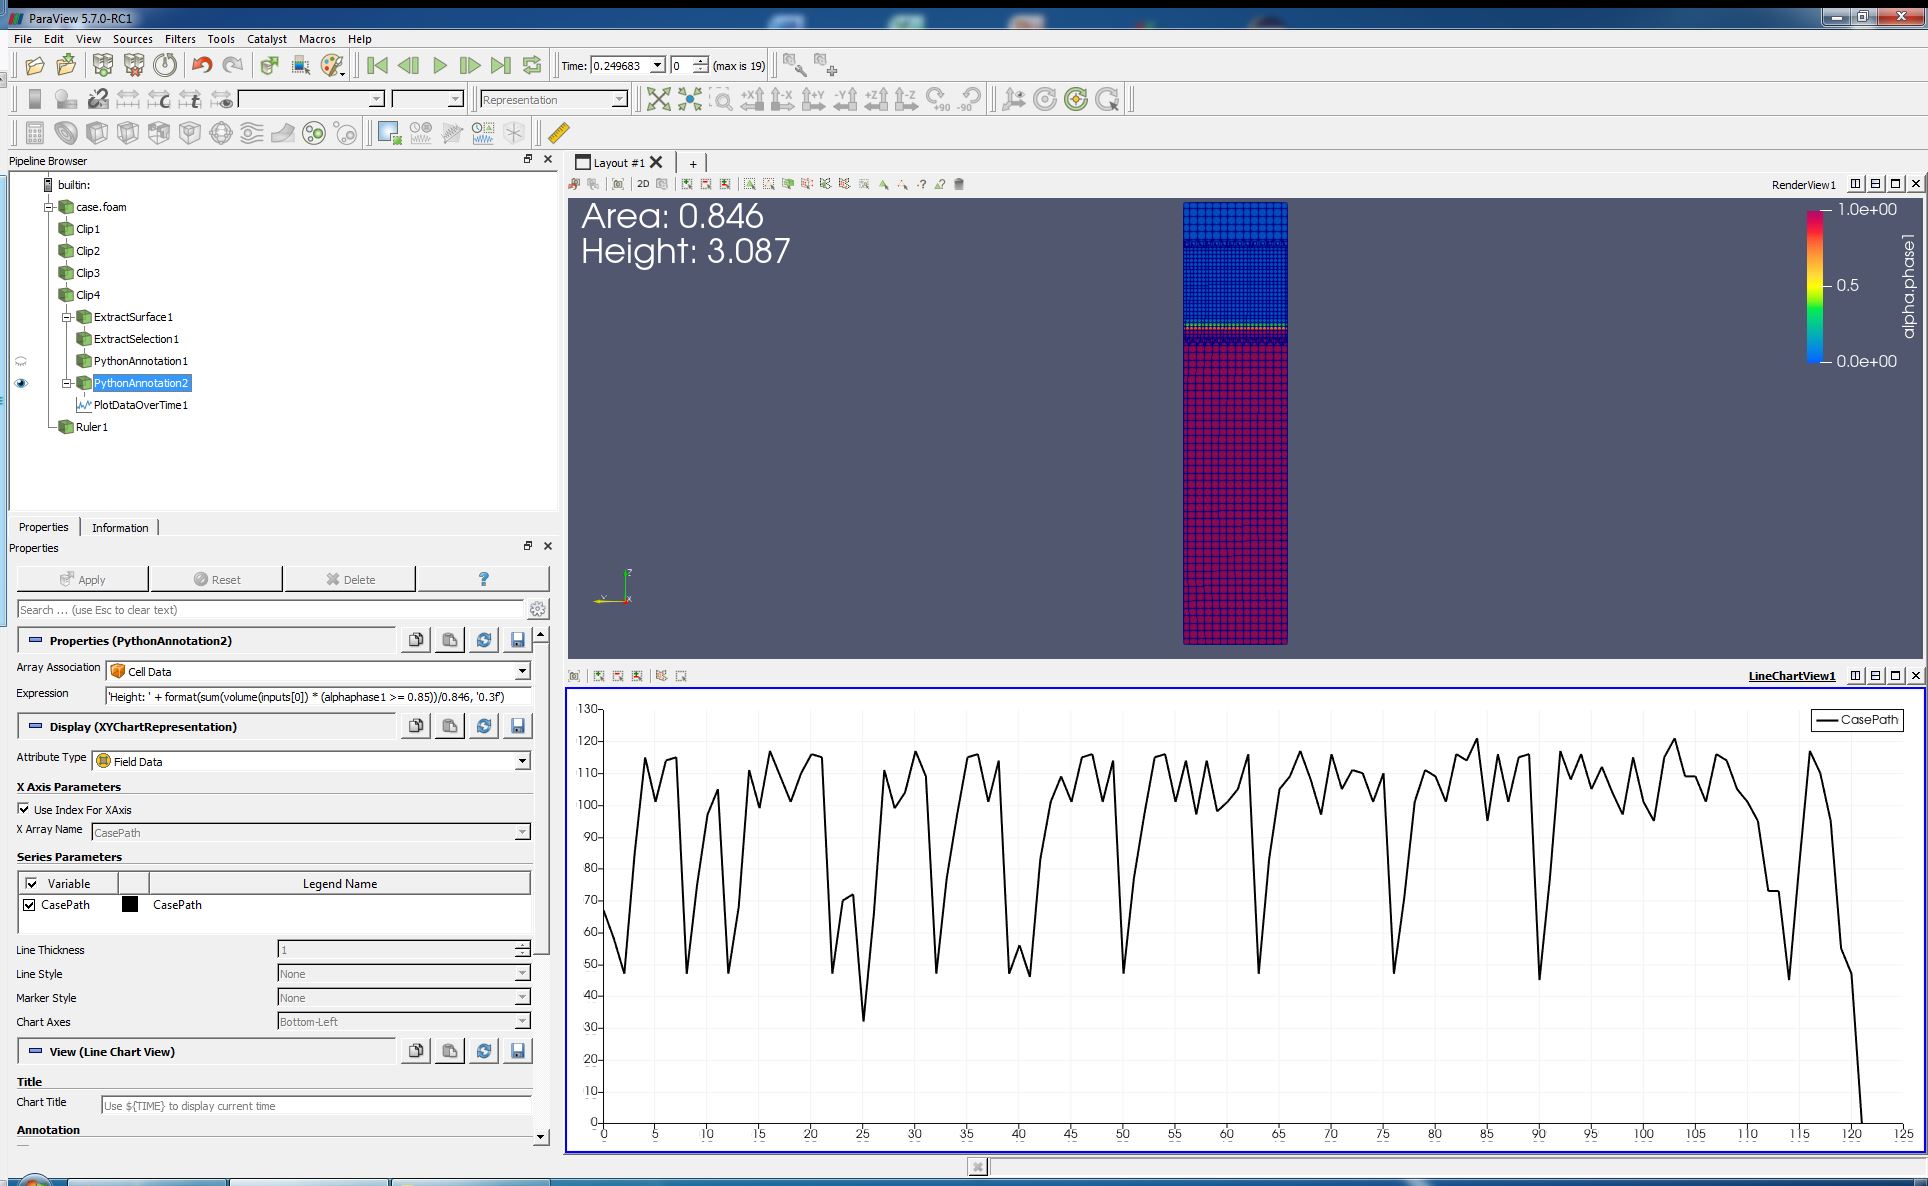
I tried to add a the filter PlotDataOverTime, but its shows a CasePath ?!
What kind of data is this ?! Furthermore i got only 19 time steps, it shows about 120 ?
How can i display the height ?
Best regards
Kai