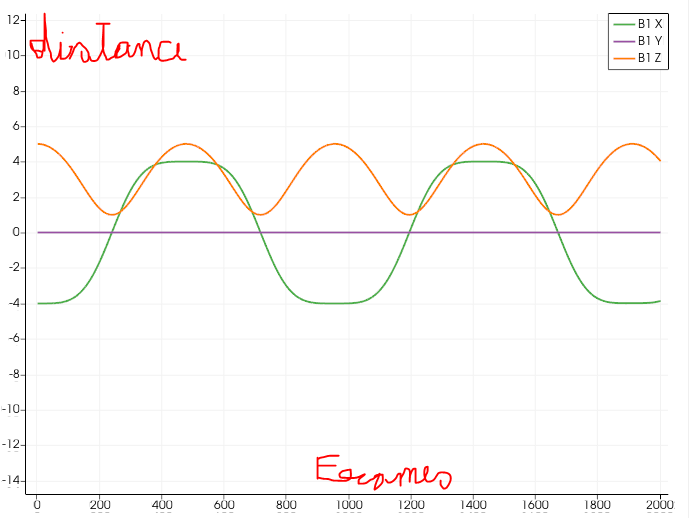
Right now I have a Plot data like this:
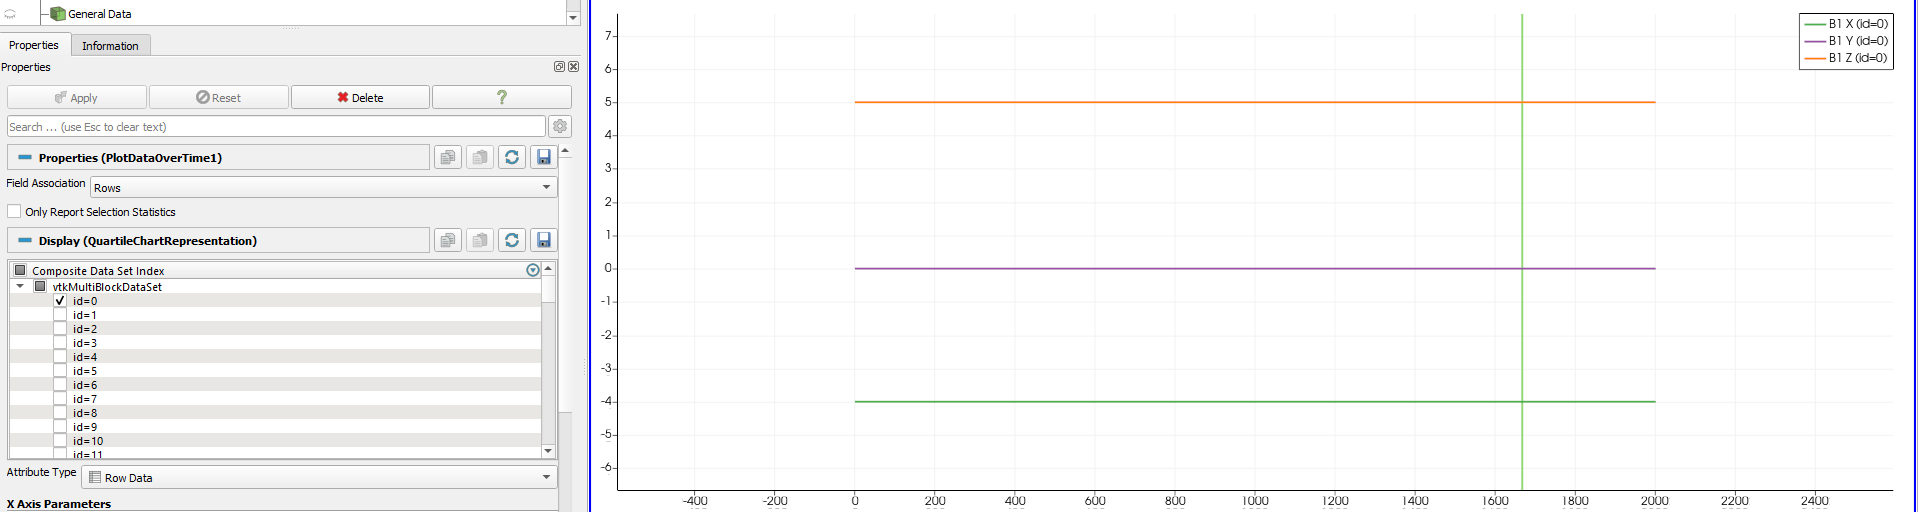
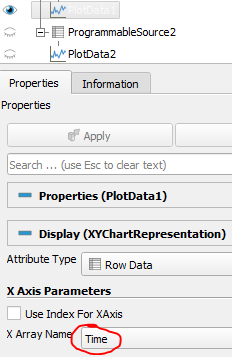
But I want to display a “time bar”. The only way that I found to to do this It was by Plot data over time and appending this code to the programable source. And this solution slowing donw prety much the animation and is displaying the data wrong. And I also i wanted to change the x axis from frames to time in secunds
timeSteps = range(100)

outInfo = self.GetOutputInformation(0)

timeRange = [timeSteps[0], timeSteps[-1]]
outInfo.Set(vtk.vtkStreamingDemandDrivenPipeline.TIME_RANGE(), timeRange, 2)
outInfo.Set(vtk.vtkStreamingDemandDrivenPipeline.TIME_STEPS(), timeSteps, len(timeSteps))