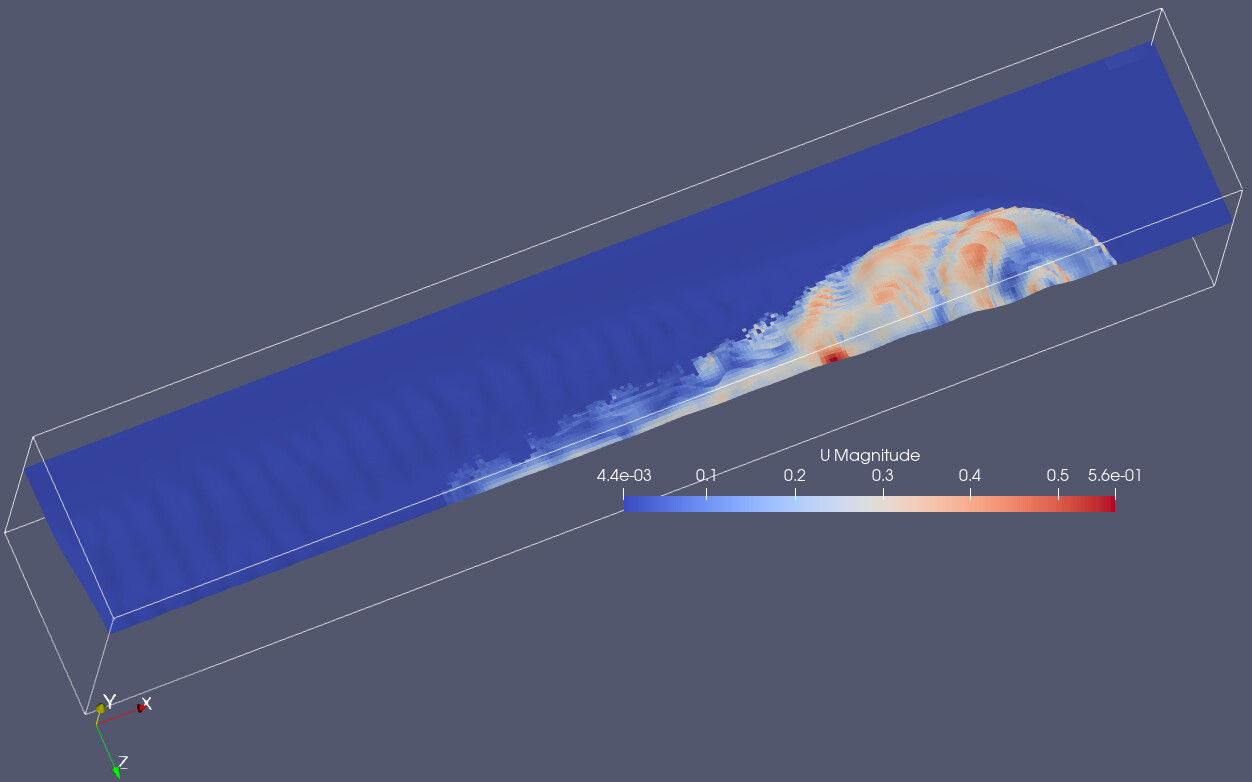
I have this kind of iso-surface (alpha = 0.5). Now I would like to plot Max(U(mag)) on that surface over time. Is it something we can do with Python ProgrammableFilter. Could you please give some hint.
(Solver: interfoam)
I uploaded my data to the link below. I uploaded only about 6 time-steps to reduce the size of the file but in my original file, I have about 700 time steps.
So ideally, what I was looking forward to doing was to obtain the maximum velocity magnitude for each time-step at the isosurface of alpha.phase1 = 0.5.
Currently, I take a contour of alpha.phase1 with value 0.5 and visualize the velocity and see that maximum velocity. This is a very lengthy process and not possible to do for 700 time steps for several cases.
I would appreciate if there is a way around extracting it with ProgrammableFilter.