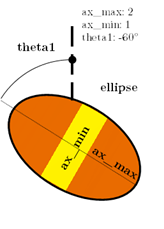
I have tried using the Tensor Glyph Filter and the vtkwrite.m MATLAB function, but as I do not understand how to build the tensor, I am not getting success. What I usually know about the ellipses is the magnitude (length/size) of the semiaxis (major and minor) and also a rotation angle. Besides that, the ellipses are a 2-D representation in the XY plane:
Can somebody please help me or explain to me how to represent them or how to build the tensor in terms of the minor axis, major axis, and rotation angle? At this point I am just getting success with the color code of the ellipses
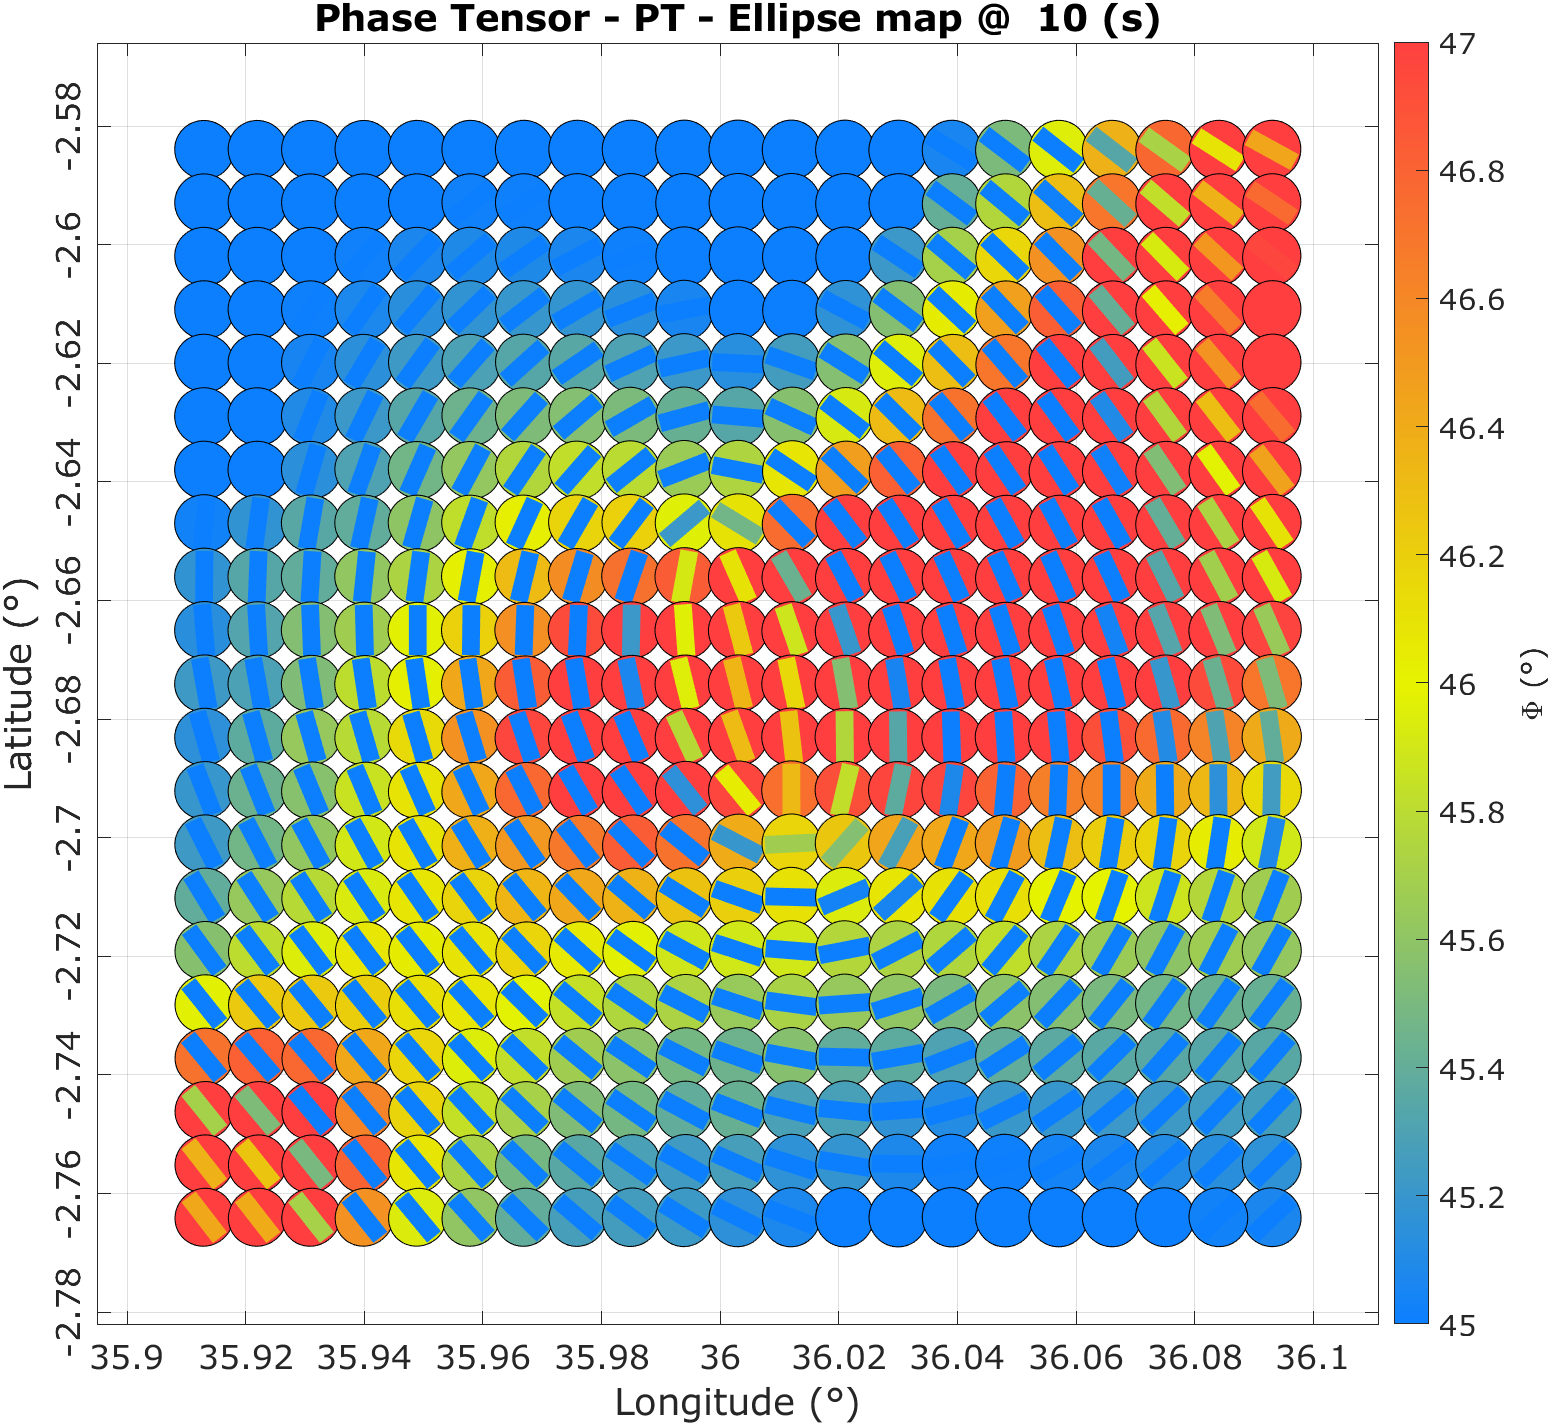
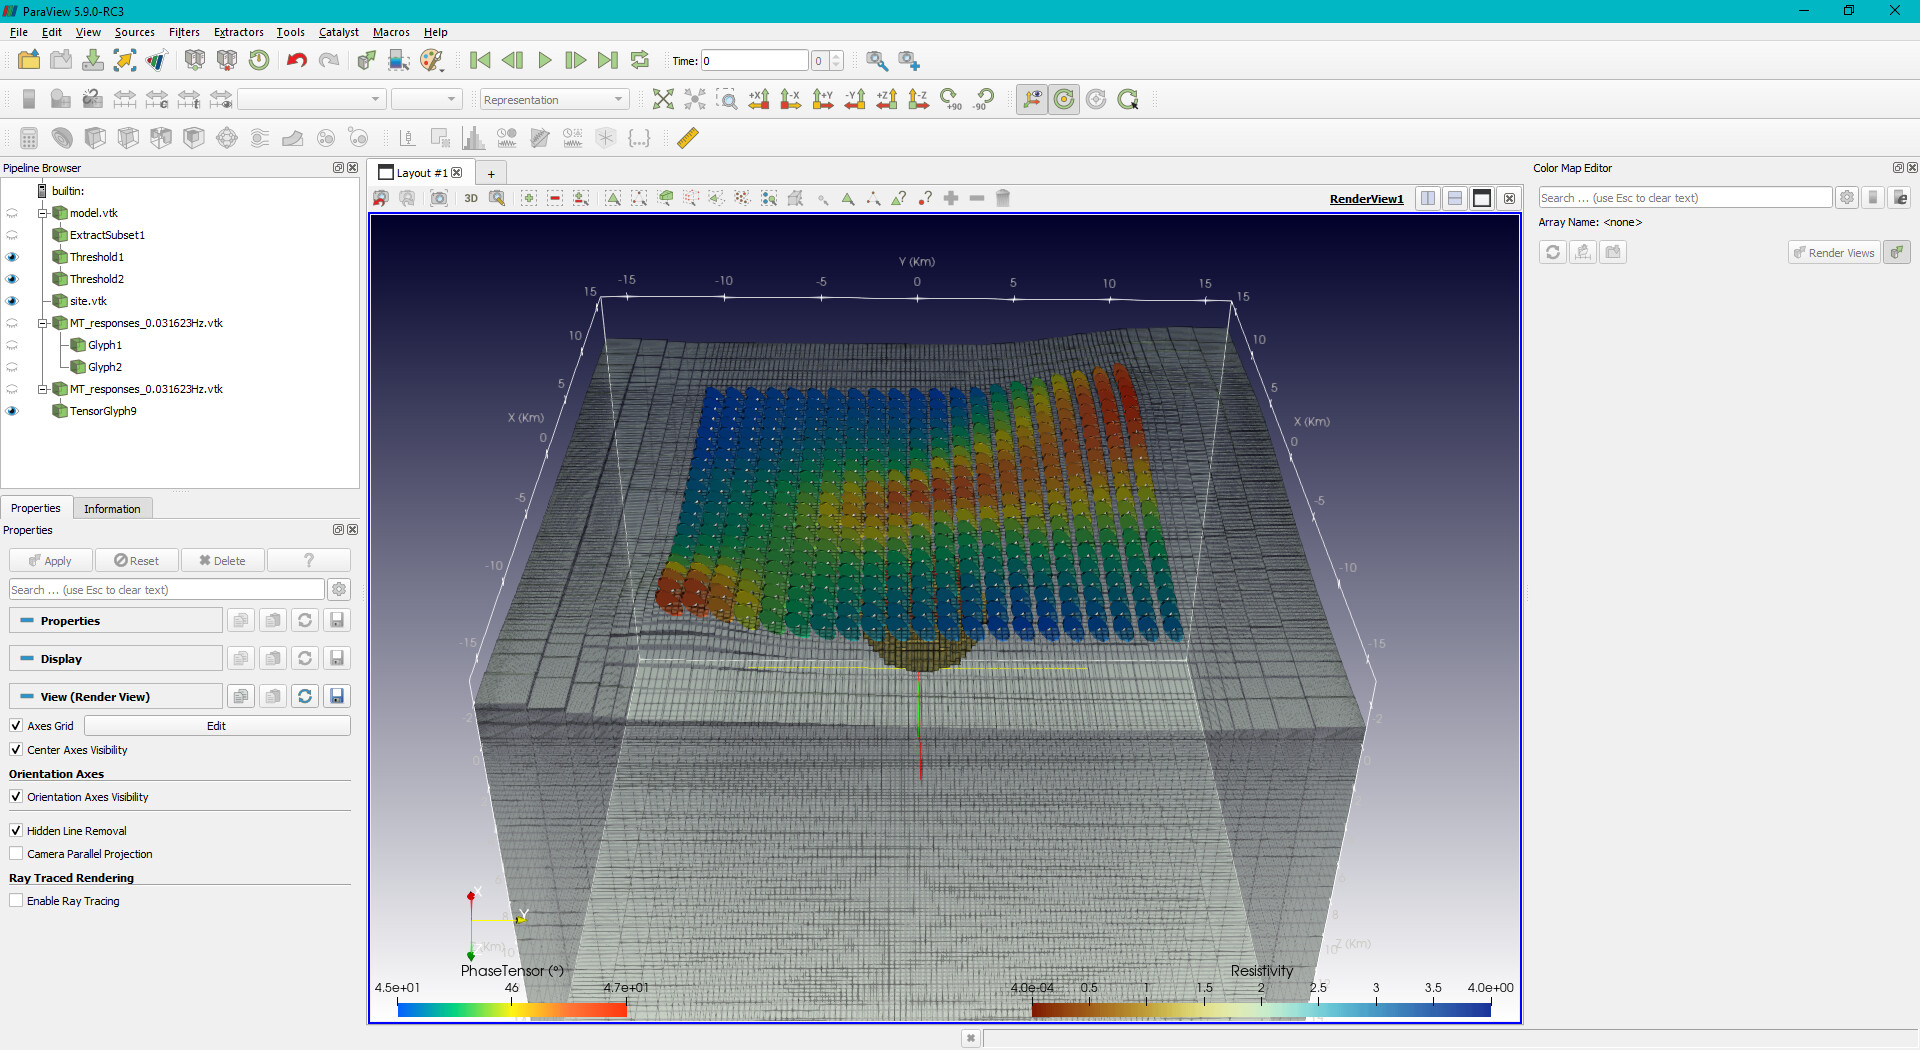
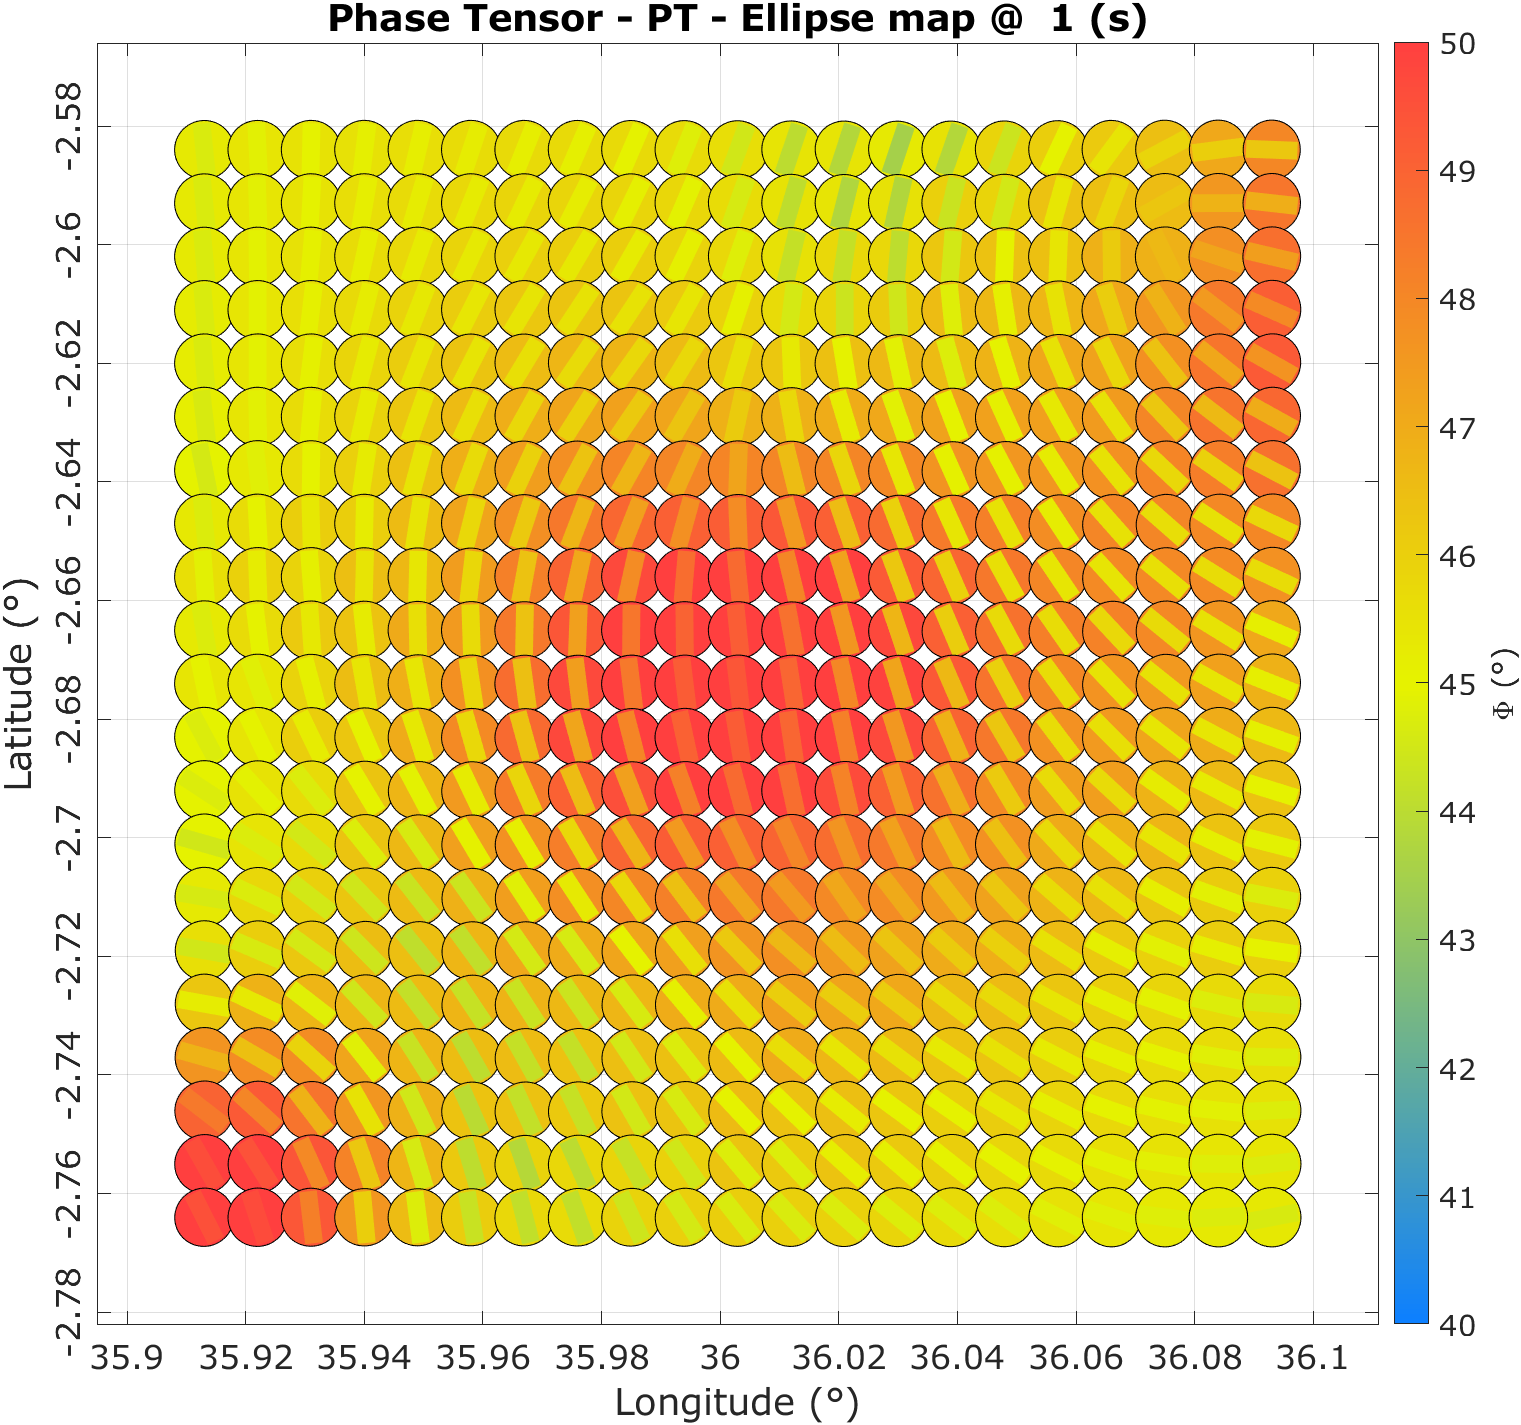
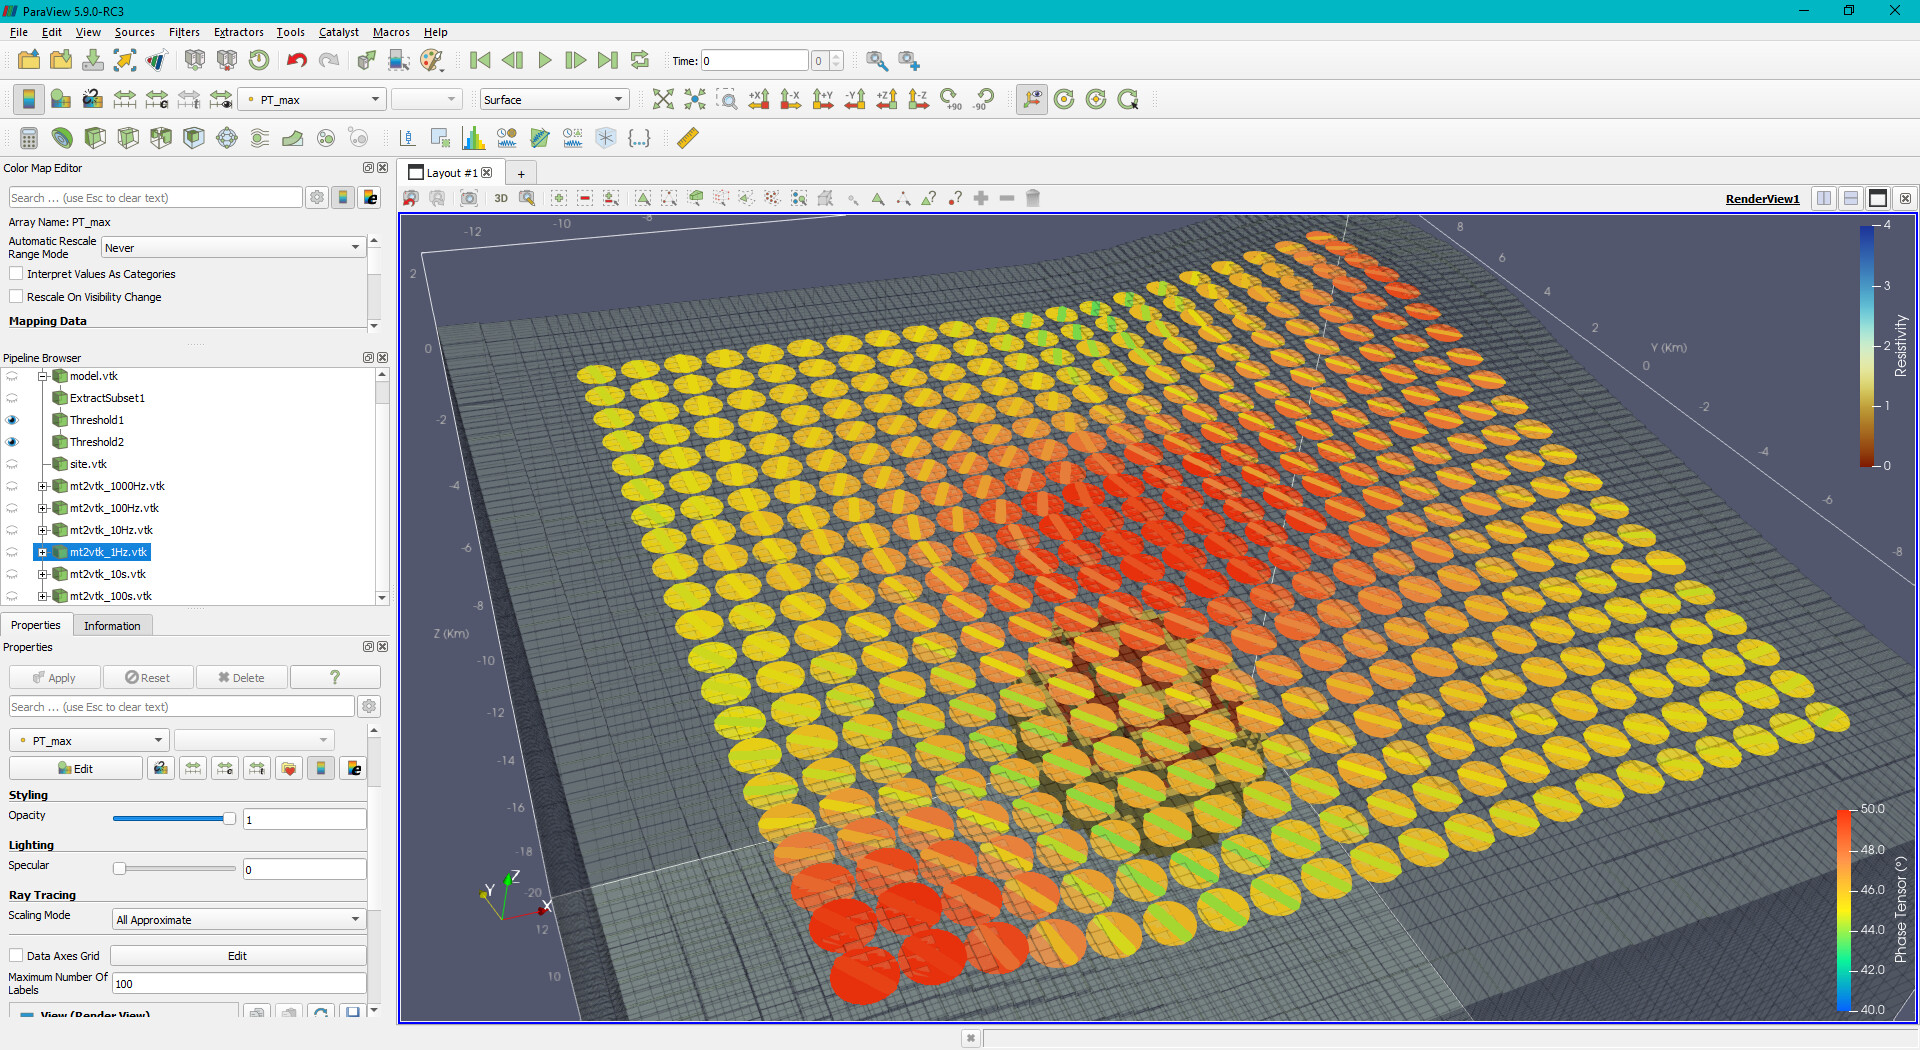
Thanks for your help, the link you posted was useful for me to understand how to build the tensor structures. Here you can see some images of the results: