Hello everyone,
I want to plot “Total Kinetic Energy” of the domain with respect to time in paraview to check whether my Simulation has achieved steady-state or not. I am not getting any suitable filters/options to do that. Can anybody help me with that?
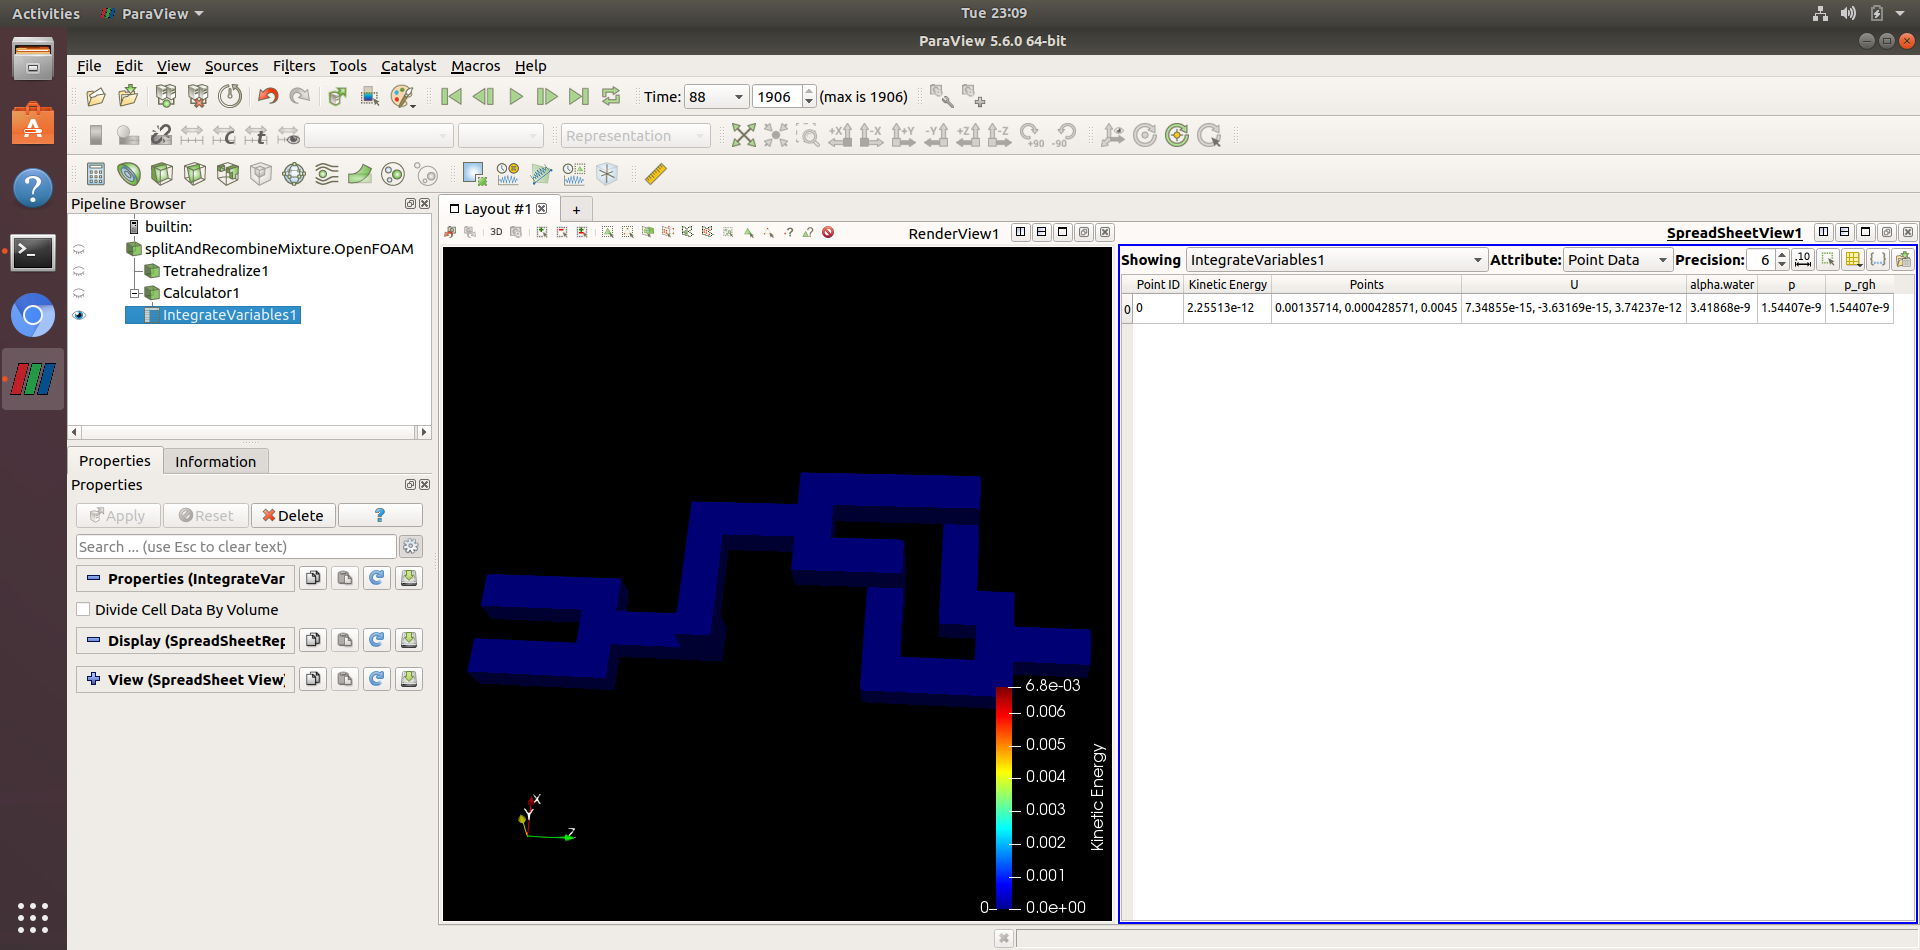
Using python calculator, I calculated the scalar field for kinetic energy but I am not getting how I can sum of all the K.E. of the domain as an individual variable and then plot it with respect to time.
I am simulating the mixing of two microfluidics in a split and recombine mixer.