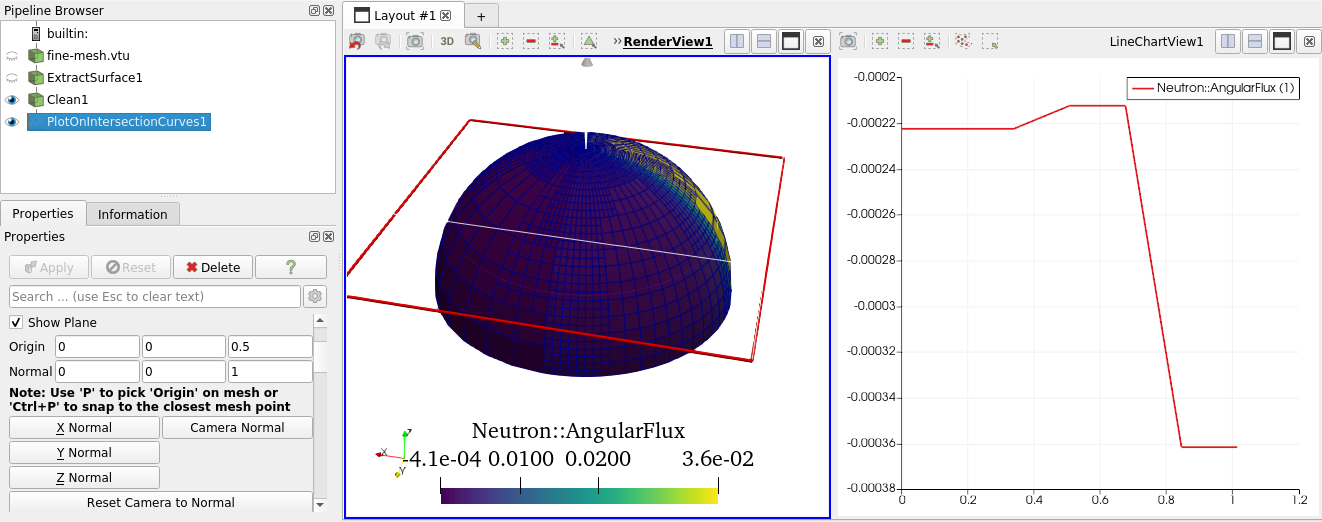
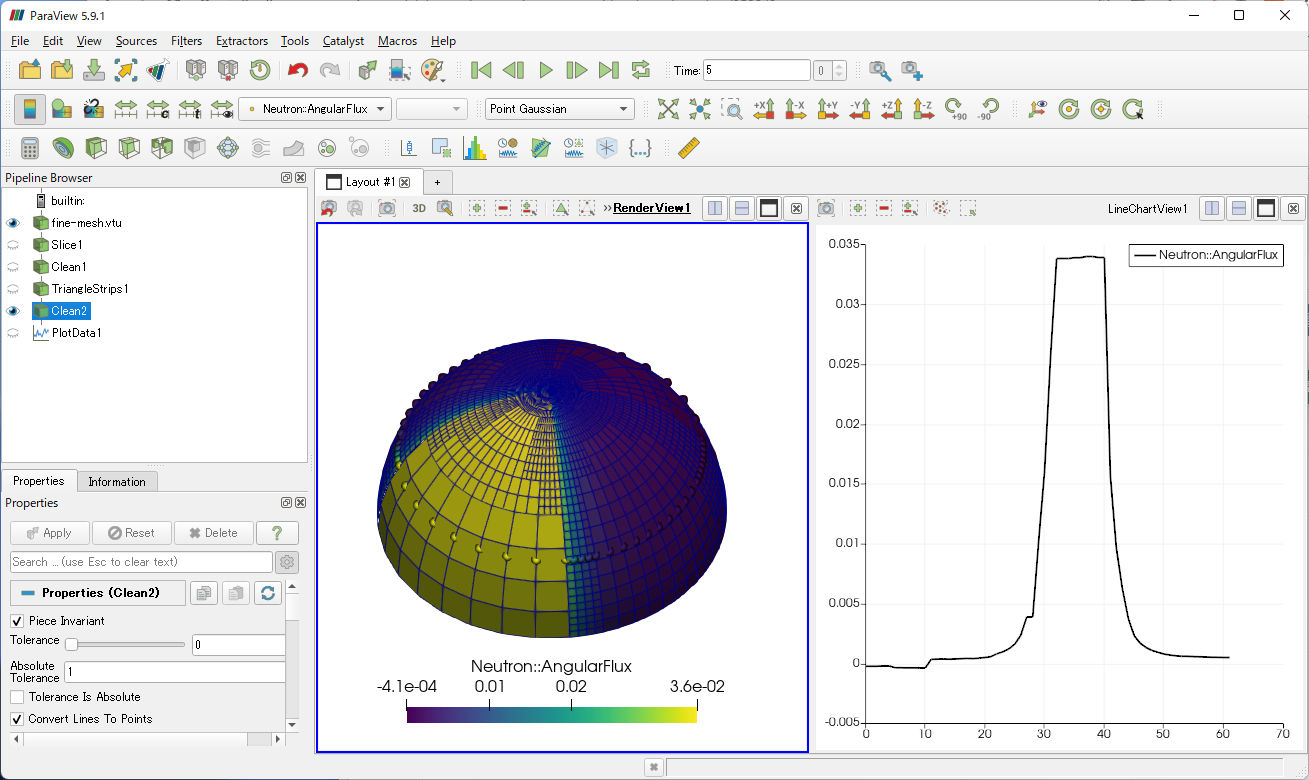
I am attempting to plot the intersection of a plane with a semi-spherical hollow mesh, however because the mesh is discontinuous and adapted the Plot on Intersection Curves filter gets “confused”.
I have tried my best to remove duplicate points and extract the surface mesh but it does not seem to eliminate the problem.
I suspect that I can achieve what I want with Python and matplotlib but I was hoping to do this through ParaView.
Is there a way to achieve a line plot on the of the mesh surface without remeshing my surface mesh? Am I missing something obvious?
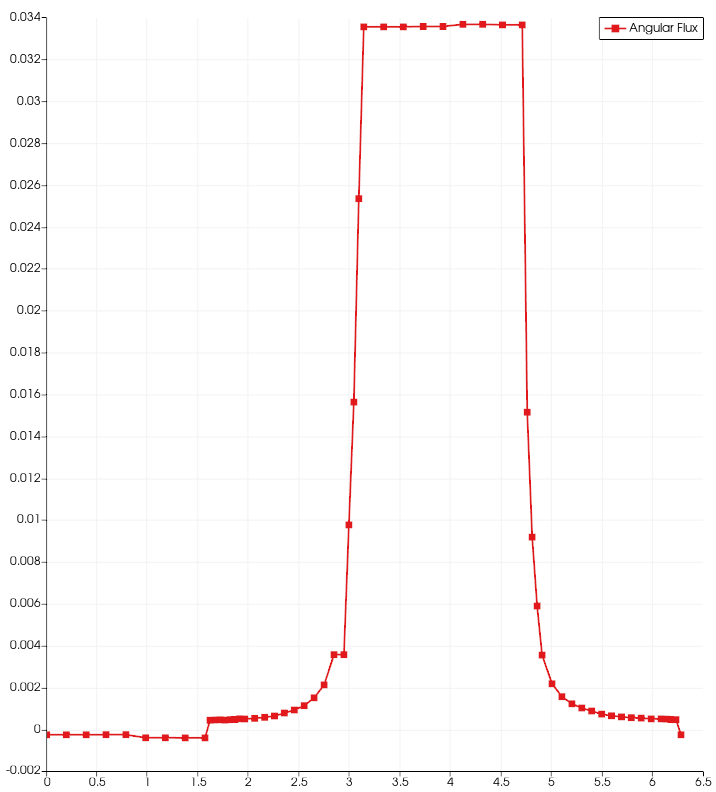
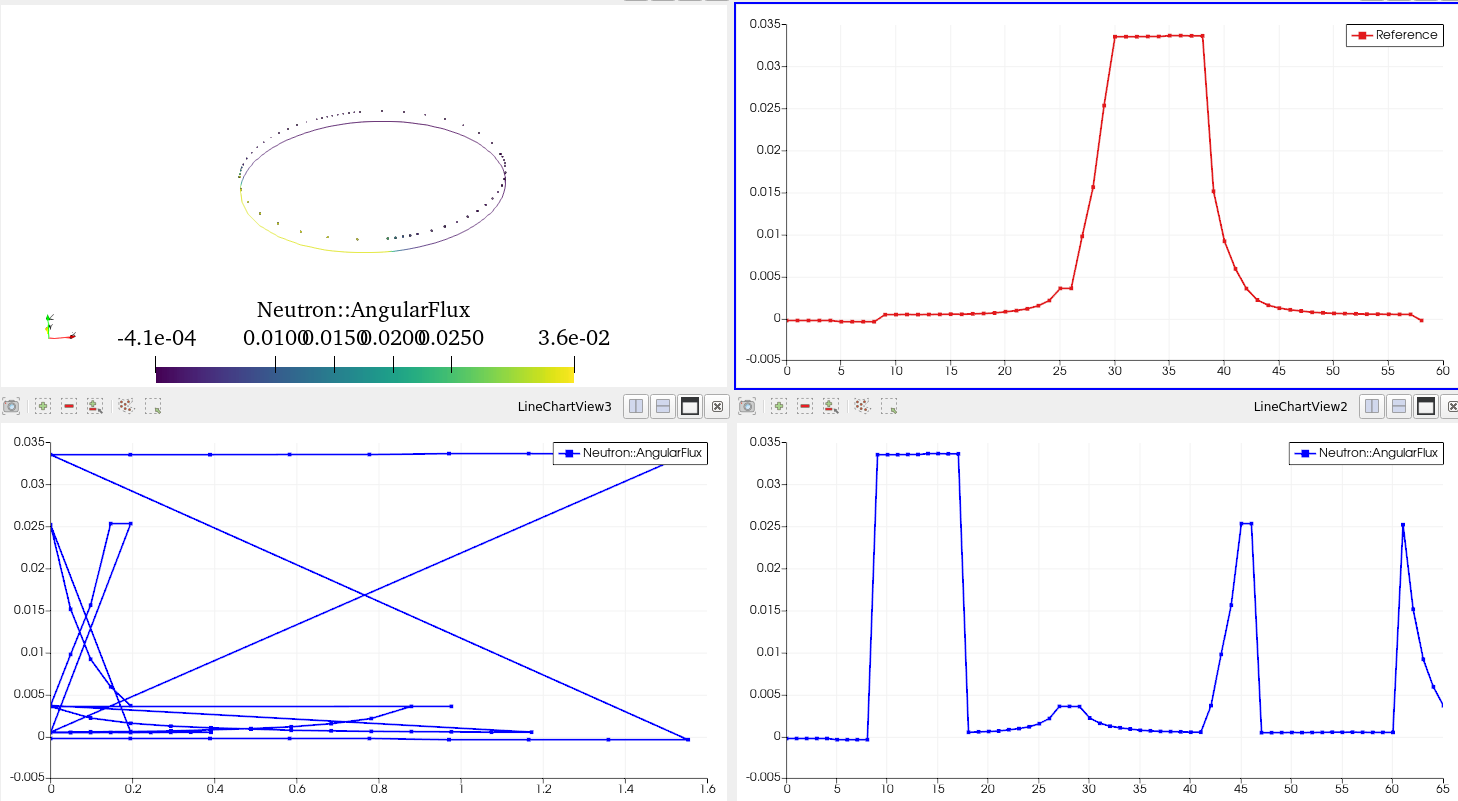
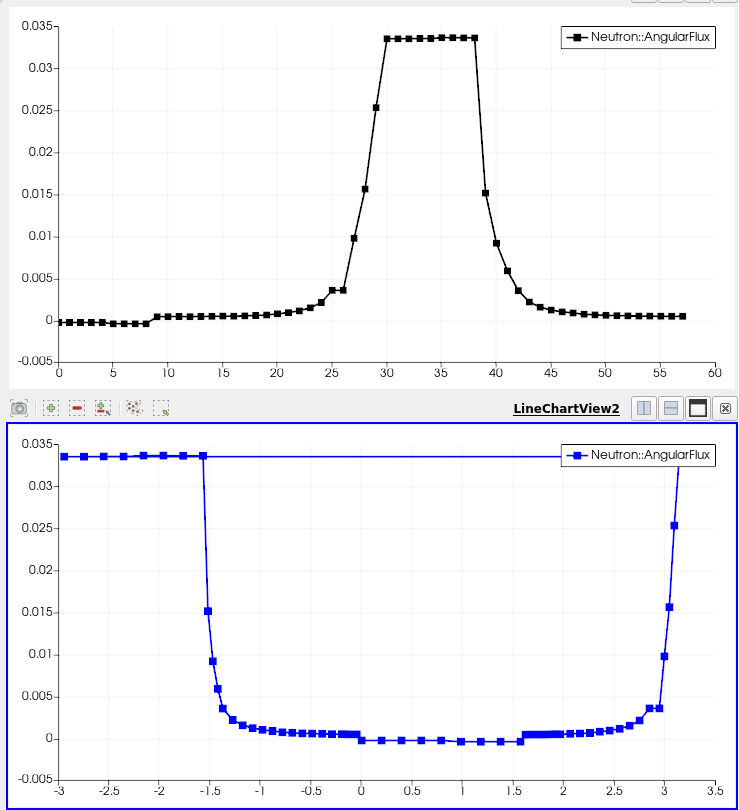
I have updated my question with an expected output, as for the “confused” the intersection filter simply fails to extract all the data into one block, instead it produces multiple blocks which when merged with MergeBlocks result in an out of order merged line-plot. Using the index for X axis results into more reasonable looking line plots, which unfortunately are not correct and do not contain any of the features of the adapted mesh (points are equidistant)
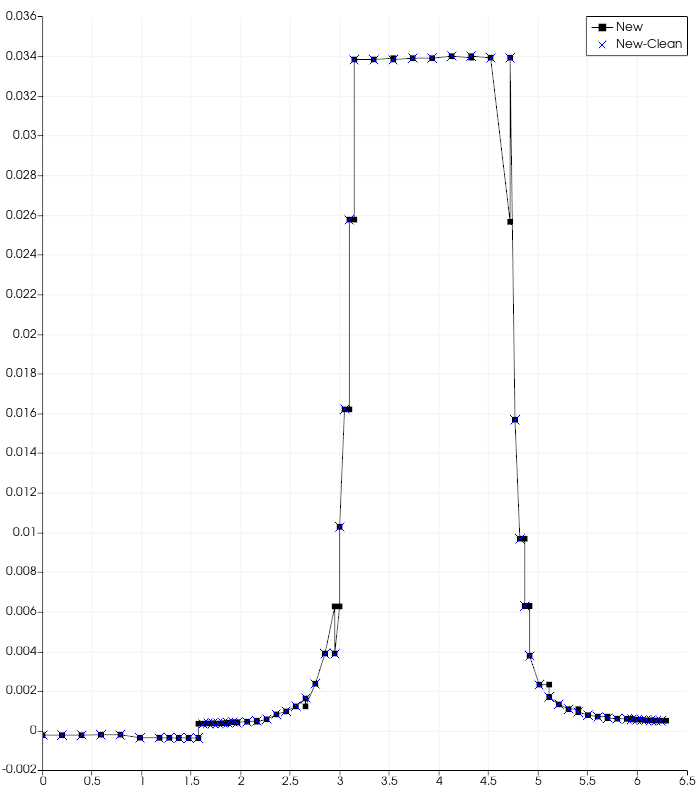
Thank you for the extra info. The X-axis of your reference graph is the key. How are the x-positions of the points of the graph generated ? Once you find that you can regenerate this values with the Calculator filter and use them as X-axis for your graph.
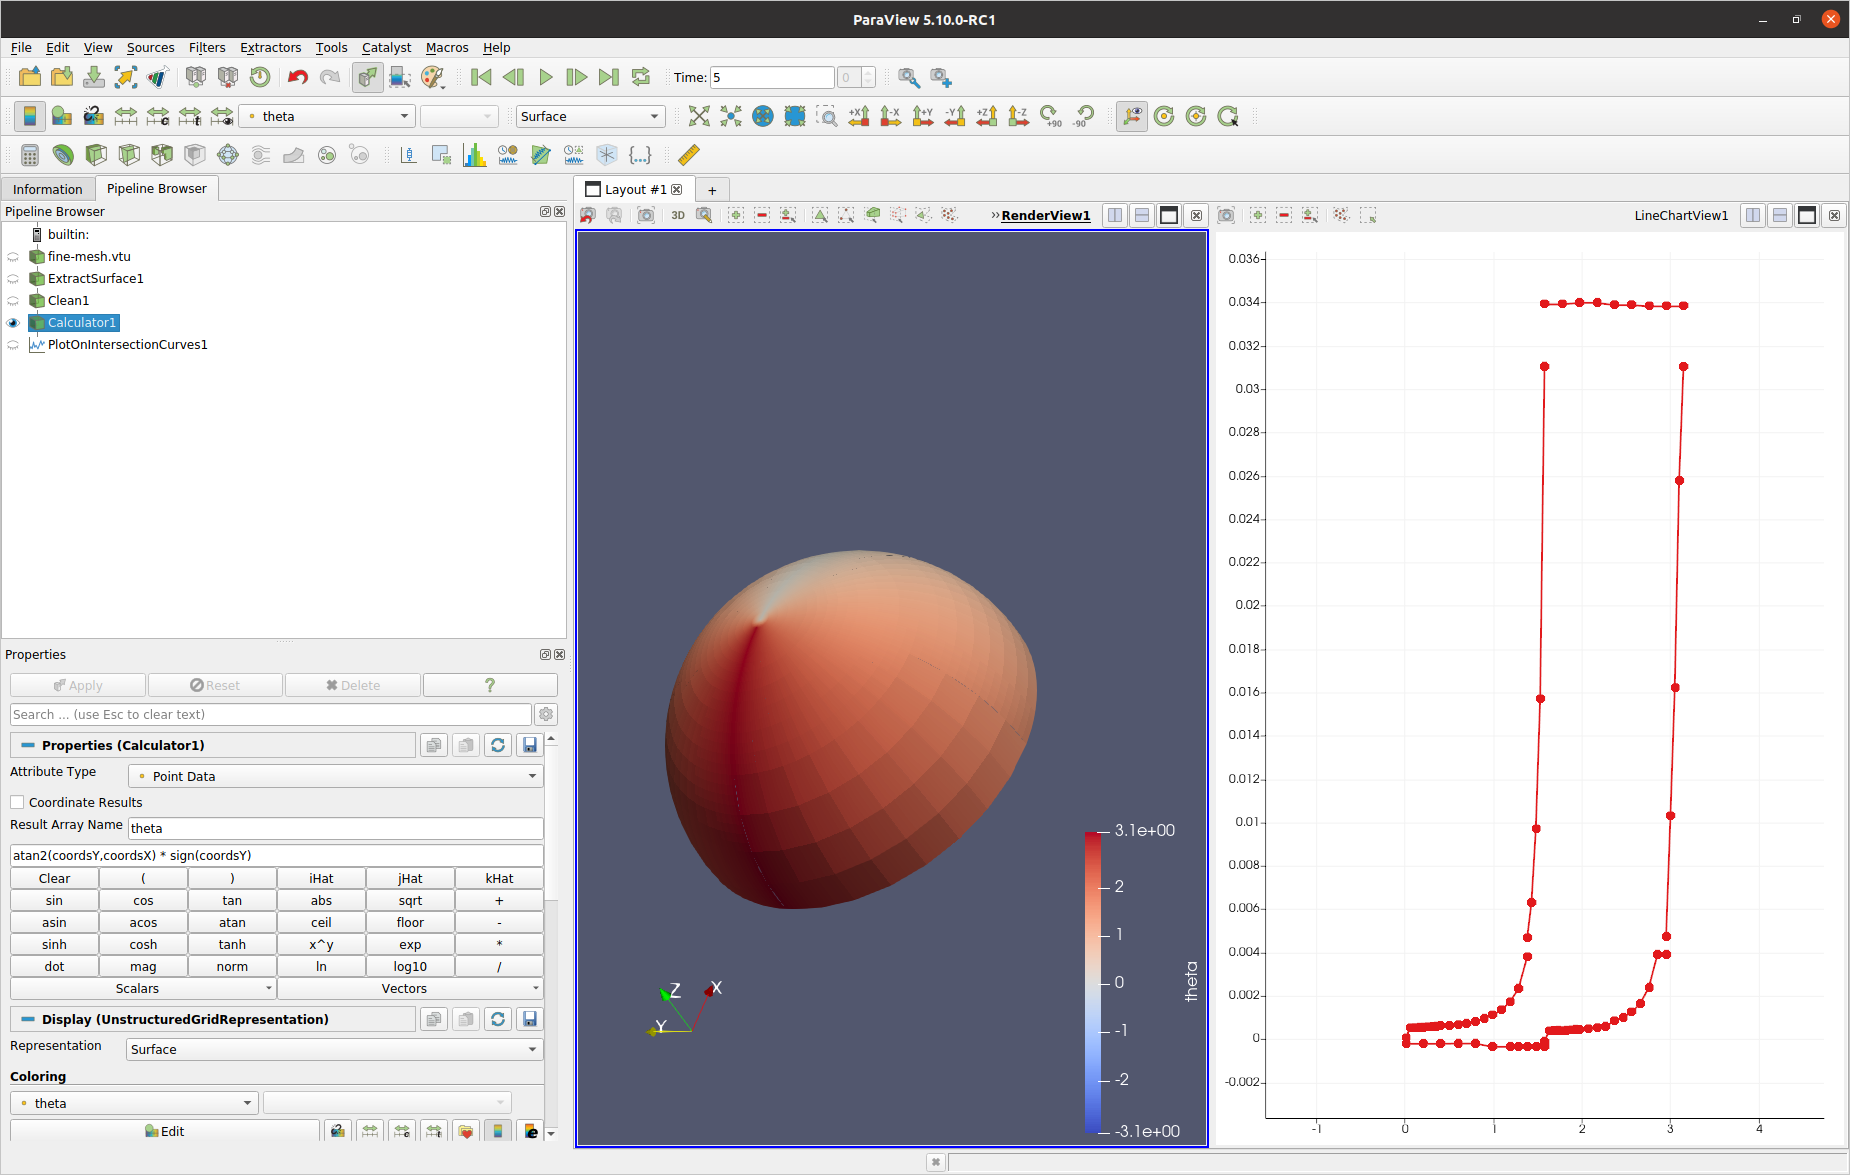
For example in the figure below Calculator is used to evaluate the angle of a point with respect to the X-axis (polar coordinates) which we store as theta. The plot is then generated setting X Array Name = theta.
The plot is close to the reference but not quite. Tweaking the formula to match the reference should do the trick.
How are the x-positions of the points of the graph generated
The mesh is a unit sphere with x-y in the range of [-1,1], so the x-axis of the line plot is just the azimuthal angle (in radians) spanning [0,2π], or in my case, pretty inconventiantly, [-π,π].
The Cartesian to spherical polar projection you mentioned is quite useful but I suspect that the reason it ends up looking like it does is because atan2(y/x) for θ<0 needs a +π term.
I can probably achieve this with a programmable filter.
Using an array for the x-axis would still result into multiple Blocks, do you know of a way to append/merge these blocks using theta as an index to identify the merging order of the blocks?
Can you think of any way to circumvent this? I think that I need to take all the data <0 and shift them by π, and that would fix how the data points are connected.
As per @Kenichiro-Yoshimi suggestion to use Slice instead of Plot on Intersection Curves I have gone ahead and made a custom filter that accounts for the adapted element sizes and the out of order data points (which will result into horrible line plots).
If the discontinuous nodes are not essential one can hide them by specifying a tolerance (absolute, relative) which will enable a Clean filter. Note, that using Clean will most likely result into some data loss.
As for how to set the x-axis to arc length, it would be easy to implement this by creating your own polyline using the Programmable filter.
The following is the description of the Programmable filter in Script. Here, you need to specify vtkPolyData as Output Data Set Type of the programmable filter.
import numpy as np

input = self.GetInputDataObject(0,0)
locator = vtk.vtkCellLocator()
locator.SetDataSet(input)
locator.BuildLocator()

# Setting Constants
tol = 1e-1
z = 0.5
start_phi = 0
end_phi = 2*np.pi
num_pts = 1000
theta = np.arcsin(z)
phi = np.linspace(start_phi, end_phi, num_pts, dtype=float)

# Calculate the point coordinates of a polyline
x = np.cos(theta)*np.cos(phi)
y = np.cos(theta)*np.sin(phi)
z = np.full(num_pts, z)

# Orthogonal projection of polyline points onto the analytical model
pts = vtk.vtkPoints()
cell_id = vtk.reference(0)
closest = [0.0]*3
sub_id = vtk.reference(0)
dist = vtk.reference(0.0)
for i in range(num_pts):
    locator.FindClosestPoint([x[i],y[i],z[i]], closest, cell_id, sub_id, dist)
    pts.InsertNextPoint(closest)

# Recreate a polyline based on orthogonal projection points
poly_line = vtk.vtkPolyData()
poly_line.SetPoints(pts)

pt_ids = vtk.vtkIdList()
pt_ids.SetNumberOfIds(num_pts)
for i in range(num_pts):
    pt_ids.SetId(i, i)
poly_line.Allocate(1)
poly_line.InsertNextCell(vtk.VTK_POLY_LINE, pt_ids)

# Interpolate the calculation results on the polyline
probe = vtk.vtkProbeFilter()
probe.SetInputData(poly_line)
probe.SetSourceData(input)
probe.SetTolerance(tol)
probe.ComputeToleranceOff()
probe.Update()

output.DeepCopy(probe.GetOutput())
output.PointData.append(phi, 'radians')
The following is the State file. xaxis_arc.pvsm (441.1 KB)
Hope you’re doing well! I am responding here because I have a follow-up question. I am trying to use “Plot On Intersection Curves” to plot on specific line surrounding a bubble. However for any of these filter, the data are plotted randomly and Paraview doesn’t follow the path of the line. How can I sort this issue ?
I tried to use the clean filter as mentionned by Kyoshimi but my case freezes each time I am using it ):
I am using a high defined structured 3D mesh with a .foam file, if it is helpful.