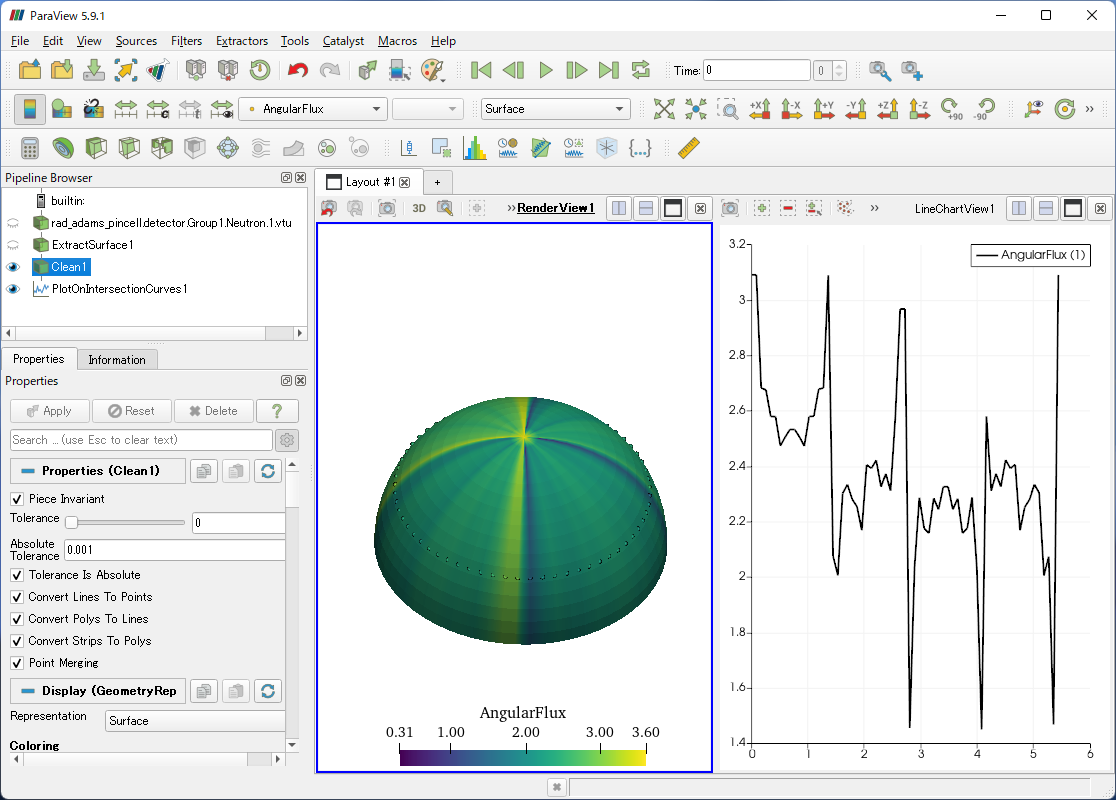
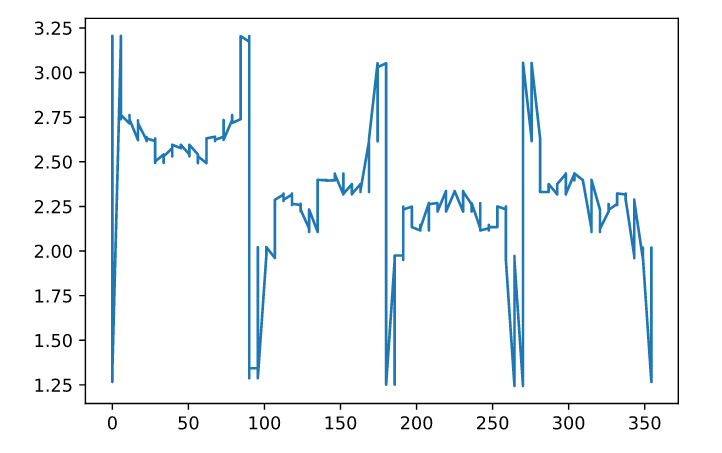
I am trying to get the line plot of the intersection of spherical shell with a plane along the z-axis using a PlotOnIntersectionCurves filter but the resulting line chart is vastly different from when the data are extracted and plotted with some other external tool e.g. Python and matplotlib.
Am I do something wrong/missing something obvious in ParaView?
Steps to replicate
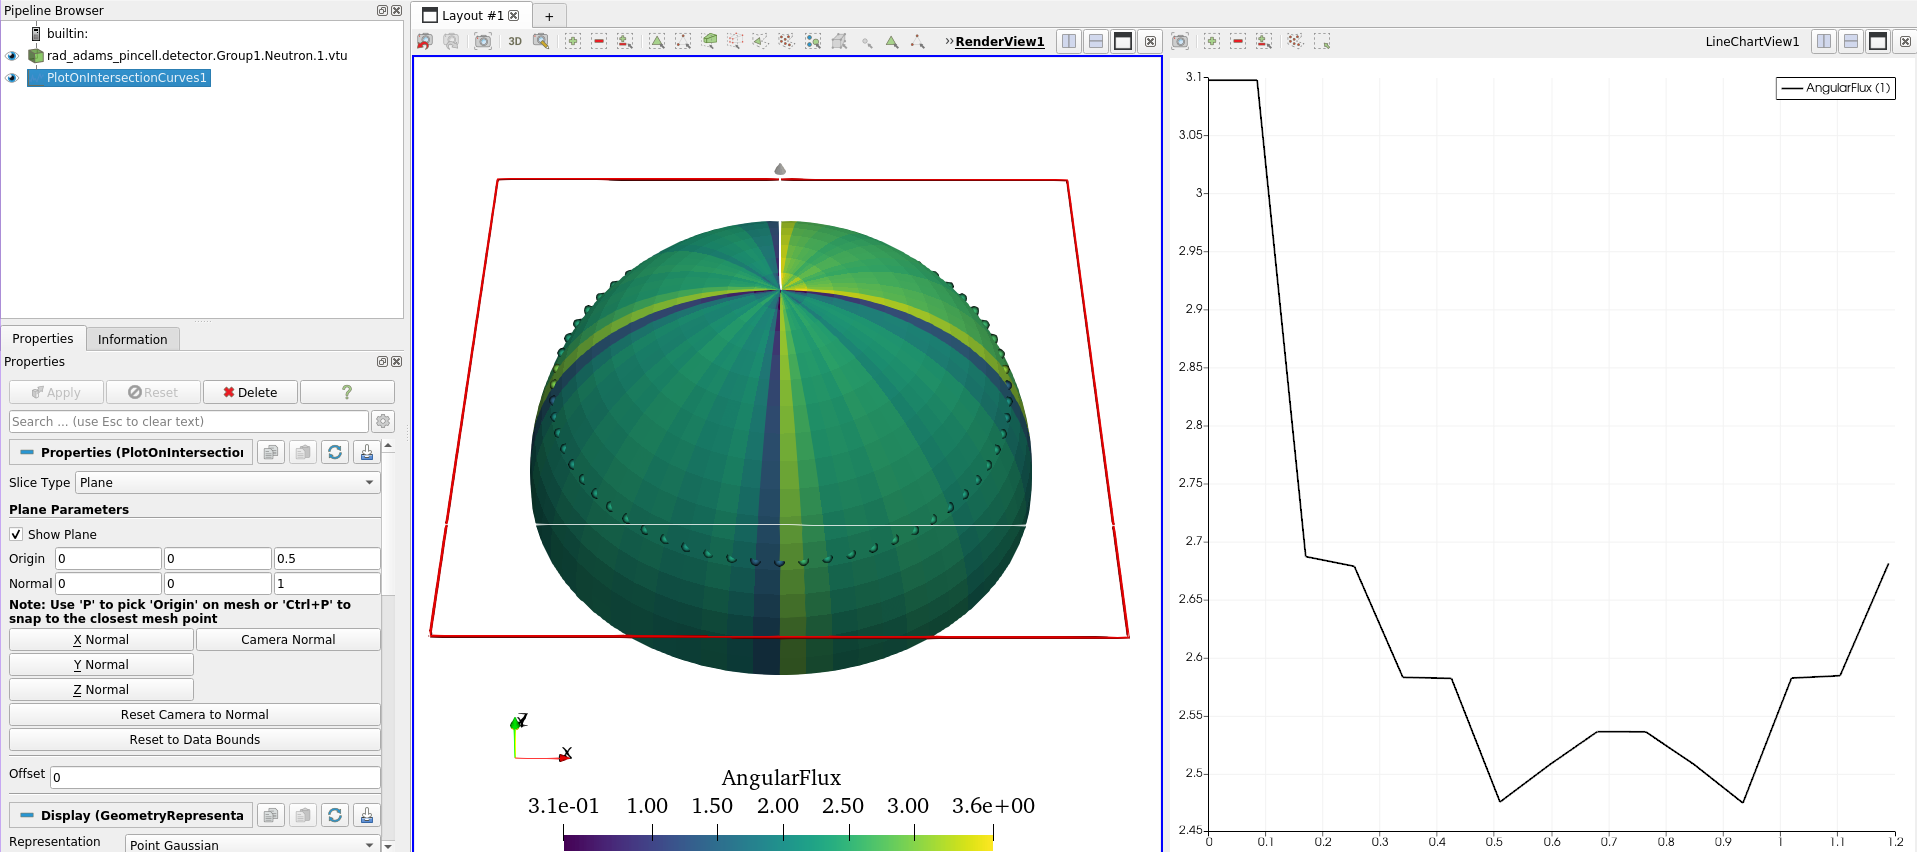
Filters > Plot on Intersection Curves- Set
Plane Parametersfor intersection curve to:
Origin: 0, 0, 0.5
Normal: 0, 0, 1
Paraview output
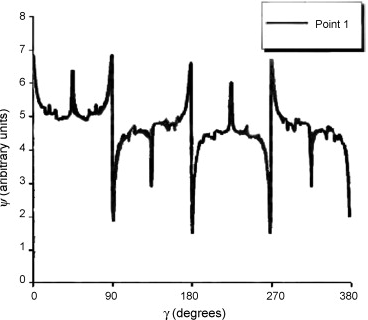
Actual result
The result albeit oscillatory agrees with the “true” solution for our problem
Files
rad_adams_pincell.detector.Group1.Neutron.1.vtu (49.5 KB)
Additional info
Paraview 5.10.0-RC1