Hello everyone,
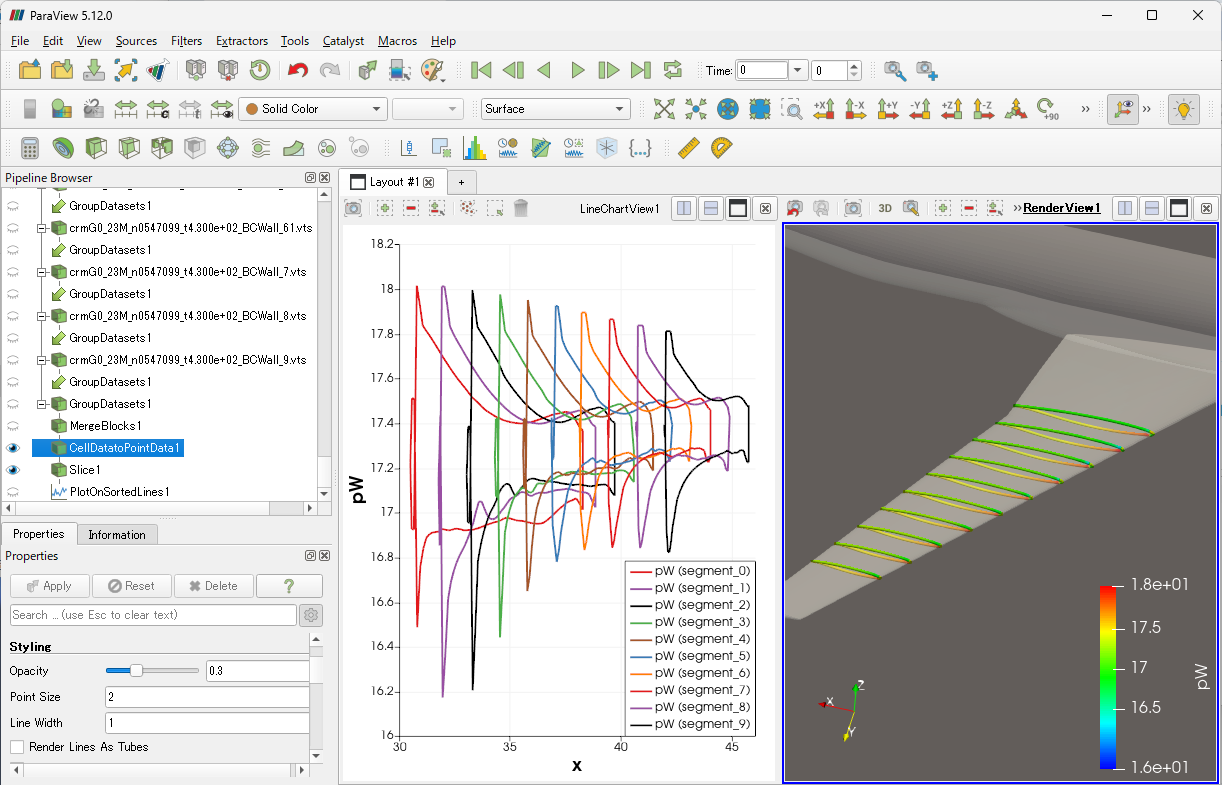
I am trying to make line plots of the pressure distribution on a specific cross-section of an aircraft wing using ParaView. I’ve exported my raw data into VTK format, and the data represents the pressure values over the wing surface. I am facing difficulties in plotting it properly. I tried two different approaches:
(a) Simply taking a slice and using the “Plot Data” filter.
(b) Importing the points coordinates, creating a polyline, applying a programmable filter, slicing along the polyline, and then plotting on the curve intersection.
Unfortunately, neither of these methods has worked for me. As I am new to ParaView, I am seeking valuable suggestions on how to plot this type of case properly. I have attached my coordinates at a certain section on the wing, VTM and VTS files for your reference.
Your assistance would be greatly appreciated.
Thank you.
crmG0_23M_n0547099_t4.300e+02_BCWall.zip (2.1 MB)
crmG0_23M_n0547099_t4.300e+02_BCWall.walldata (1.4 MB)
coordSecA.txt (9.3 KB)