The Plot Over Line filter is currently being updated. I am writing this post to gather suggestions by the community on features we could add / change, in addition of what is being implemented.
To give some context, previously, Plot Over Line was probing points in the input data sets on a uniformly sampled line set by the user. Since scalar fields on data sets is at most piece-wise linear, the filter was oversampling linear functions. The idea in the update is to propose smarter sampling patterns that would reduce the amount of sampled points without degrading (too much) the output plot.
The new version of Plot Over Line would allow the user to choose between 3 sampling heuristics. I am describing them below with illustrations:
Sample At Cell Boundaries: Points are probed on along the input line at locations where it intersects the cells of the input data sets. 2 points are being probed at those intersections: one in each interfaced cells, allowing to output sharp step functions on cell data.
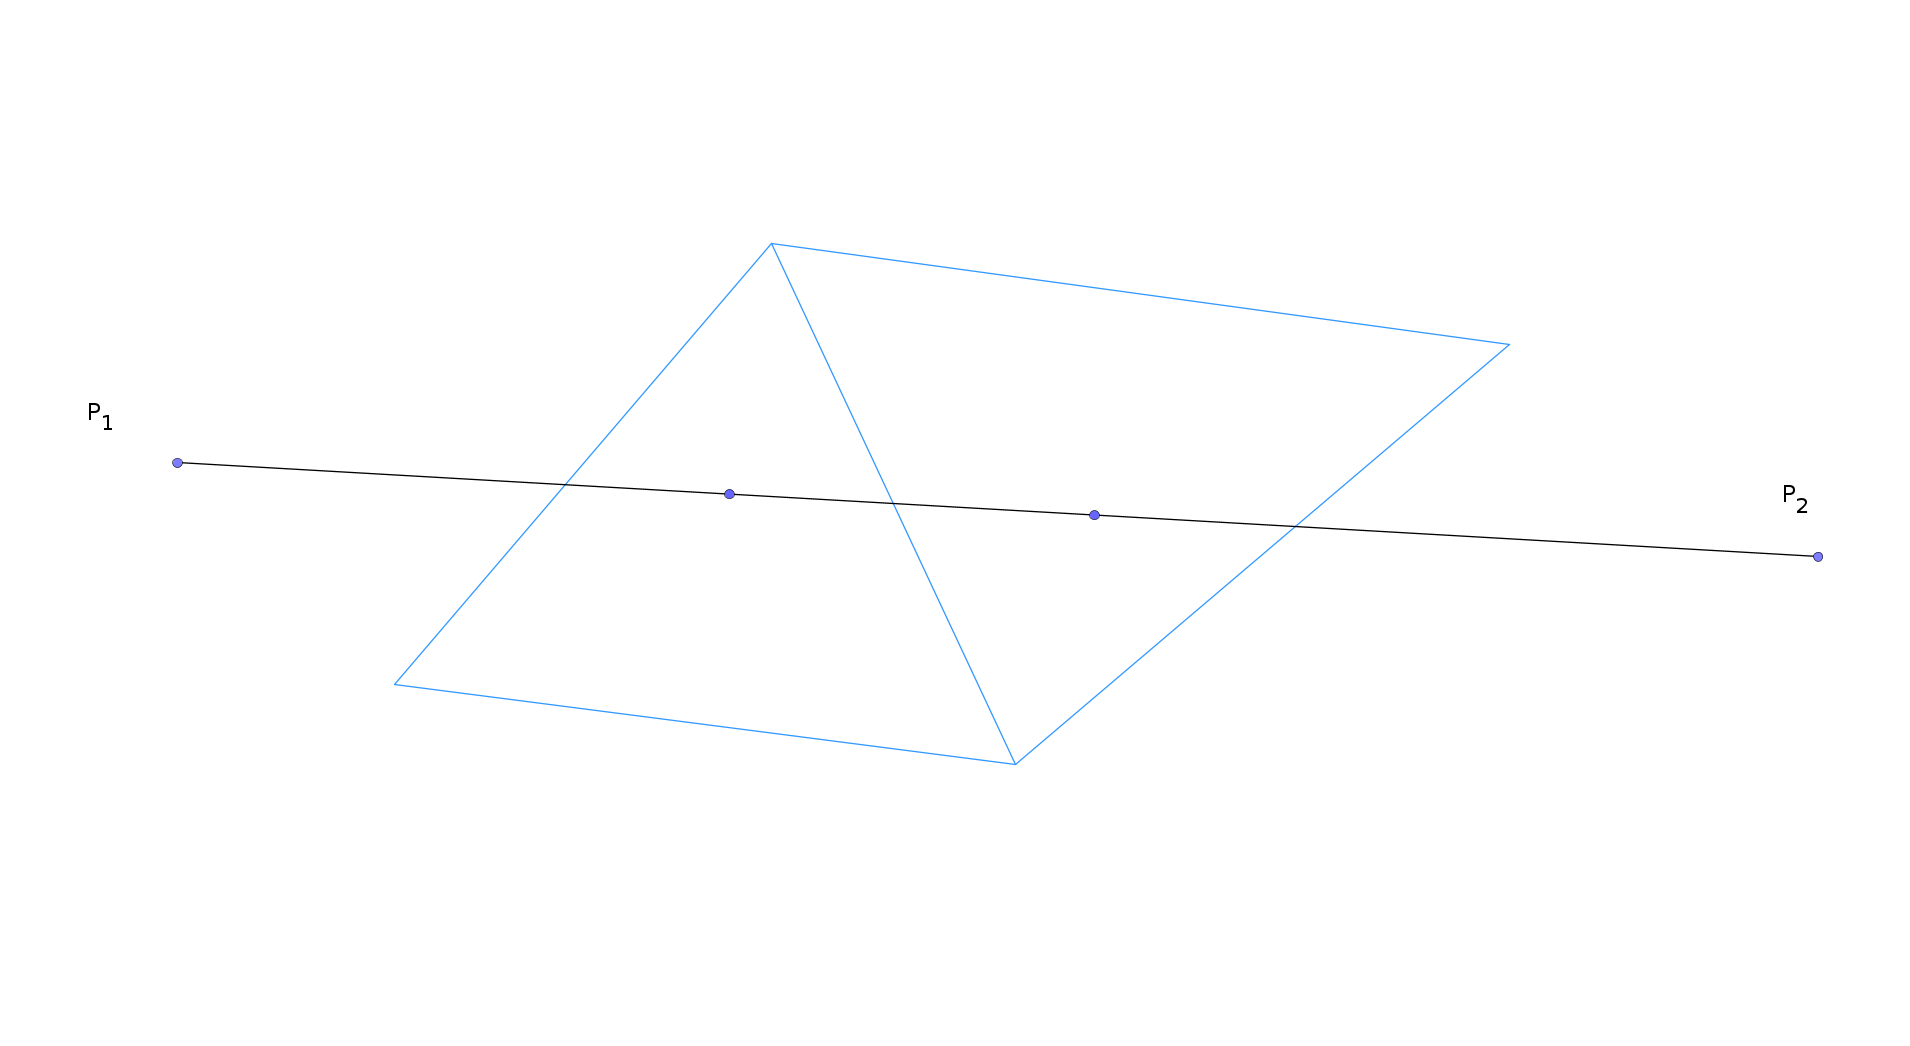
Sample at Segment Centers: Points are probed along the input line at the center of each segment formed by 2 consecutive intersection points between the line and the cells of the input data sets.
that gives one sample per cell. Despite the filter being called “Plot Over Line” plotting is not necessarily the only use for the output – boundary layer analysis use-case comes to mind. Generating csv for data at sample locations per cell may indeed be useful
Hi,
No interest in the second, for us. Several drawbacks to the third including that of missing the phenomena sub-sampling (but, we can see there a easy way of proceeding to carry out a projection towards a grid whose center of the cells would be the points)! Sorry for this.
In fact, really only the first heuristic has appeal for us. The information returned must correspond to a multi-line. The rendering is natural on the mesh, but the “curved” 2D representation (abscissa: linear position on the line, ordinate: the value field on cut-out cell) must have a “histogram” aspect (with the layout of the vertical lines for close “segmented line”).
In this example, the return is two segments associating each with the values of the cell it crosses. The interest is multiple of which to offer the possibility of carrying out a calculation of linear integral (weighting by the length of the crossing in the cell).
For borderline cases (crossing on a wall), I will opt instead for two options: an arbitrary choice (in order to define the line in a unique way) and a non-choice. Indeed, this non-choice makes it possible to keep the complete description even if it means describing the same part several times (for example, the segment for the “right” cell with the segment for the “left” cell), this will only have little impact on the rendering but above all this will allow post-processing to a user to make his choice, better to carry out a complex calculation of which he has the imagination. The generating smooth curves maybe one of the post treatments too but very often numeritians or physicists prefer to see their true value.
An important aspect of this filter is to be able to support several intersection lines during a only one call (“vectorization call”). I know, the description of a bundle of lines will not be easy at the level of the ParaView GUI but will be of great interest in scripting. At the level of the GUI, this could be limited to two choices: a beam of parallel lines with a fixed spacing (why not be limited to the axes coordinates for example) and a beam style “peacock” or “hedgehog” with an origne and angular spacing (2D and 3D).
I work with CFD and very commonly one has cell-centred data from finite-volume simulations. I have been really longing for the second option in the list, just getting one value per cell. Option one has some merit as well if one wants to visualize the constant value across the cell instead of representing it as one point.
Have you considered implementing some kind of interpolation? That would make option 3 more viable!