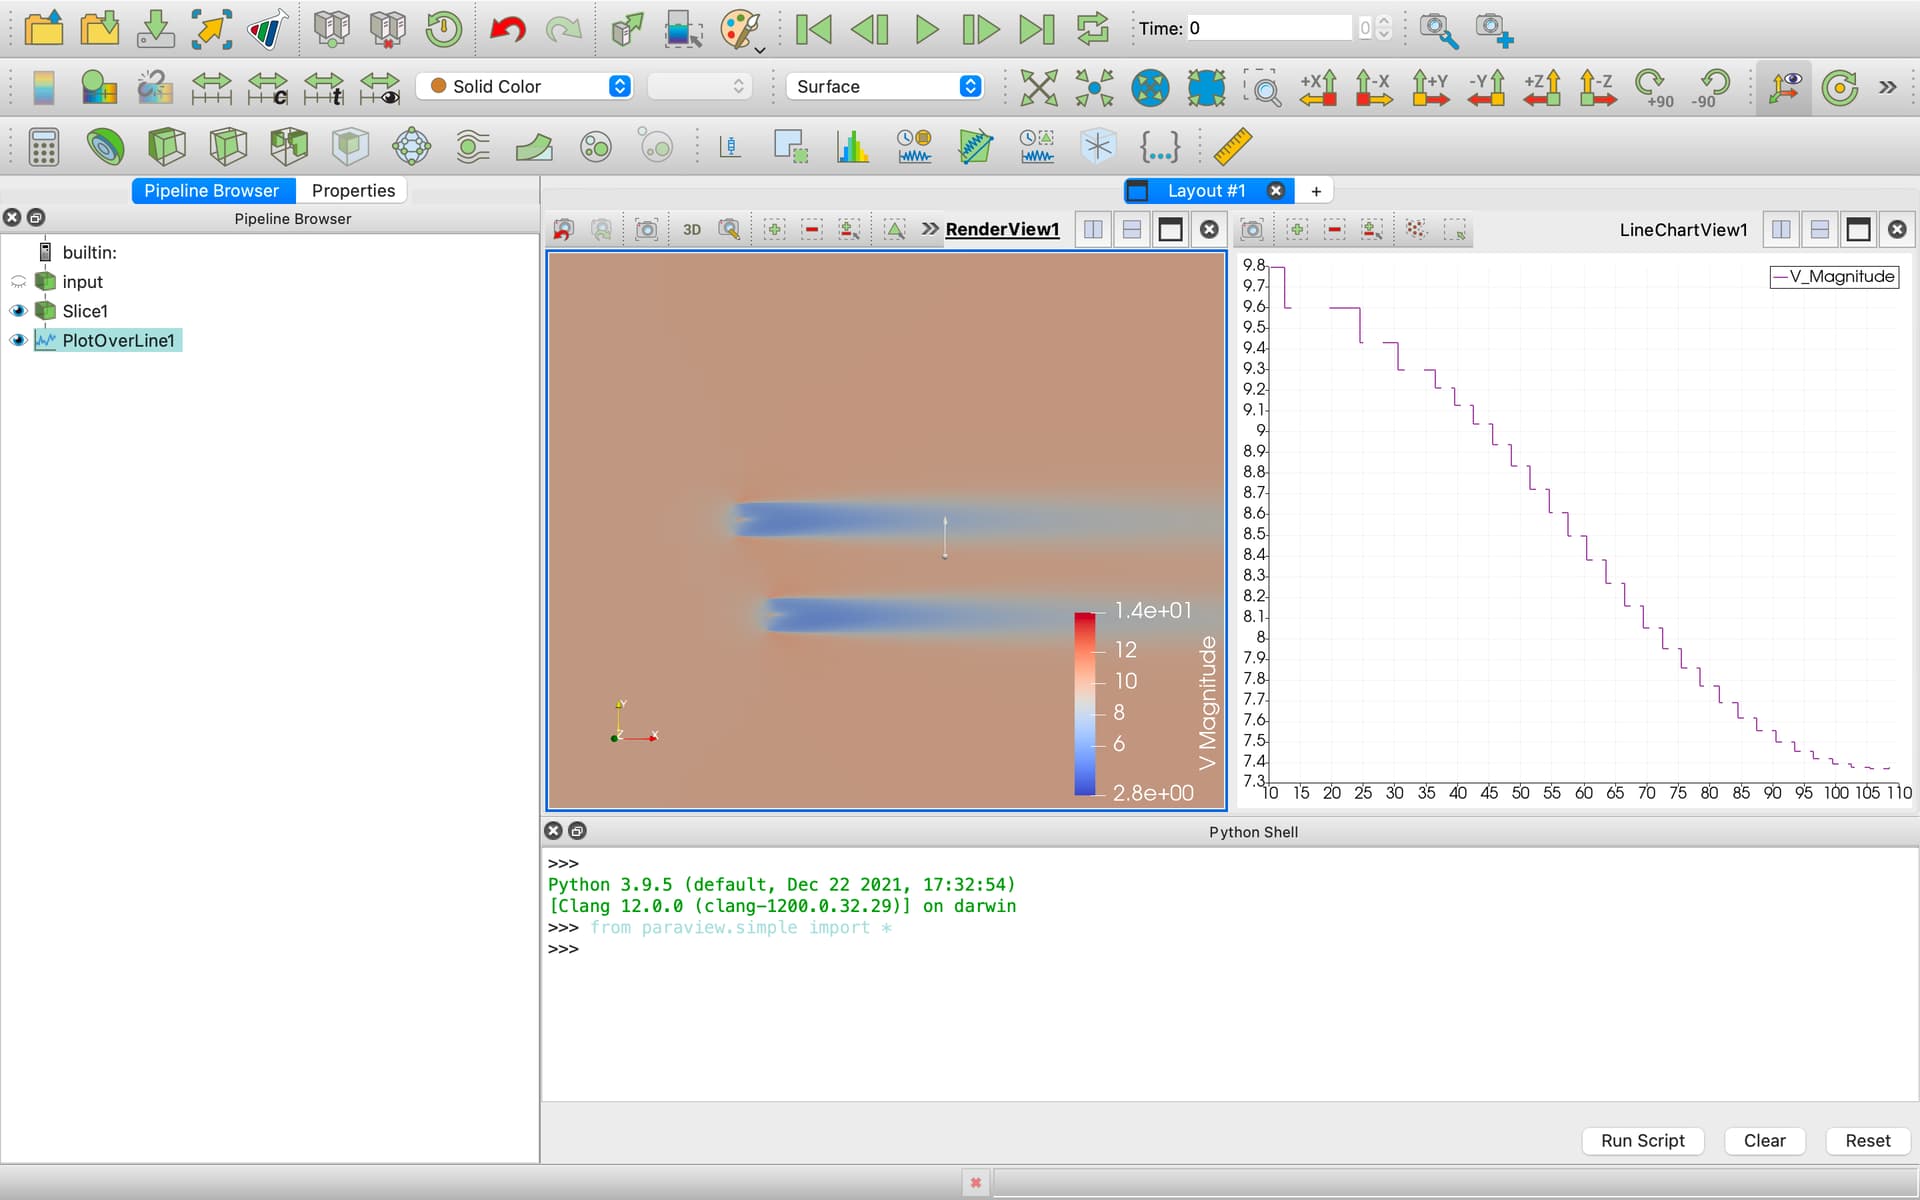
Hello! I’m trying to plot some data from a CFD simulation, but some NaN values appears in the line chart. The z coordinate should be fixed, so I used to slice filter. The x, y coordinates should be random numbers. I’ve tried to increase the resolution, but it doesn’t help.
Could you give me some guidance please? Thank you!
I have in hand now is a large zip file (more than 200MB) containing a large visualisation folder (.vtp, .pvtp, .vtu files) and a few .pvd files. I’m still quite new in using ParaView, could you please let me know what files are needed? Or is there a way I can share this zip file with you? Thanks
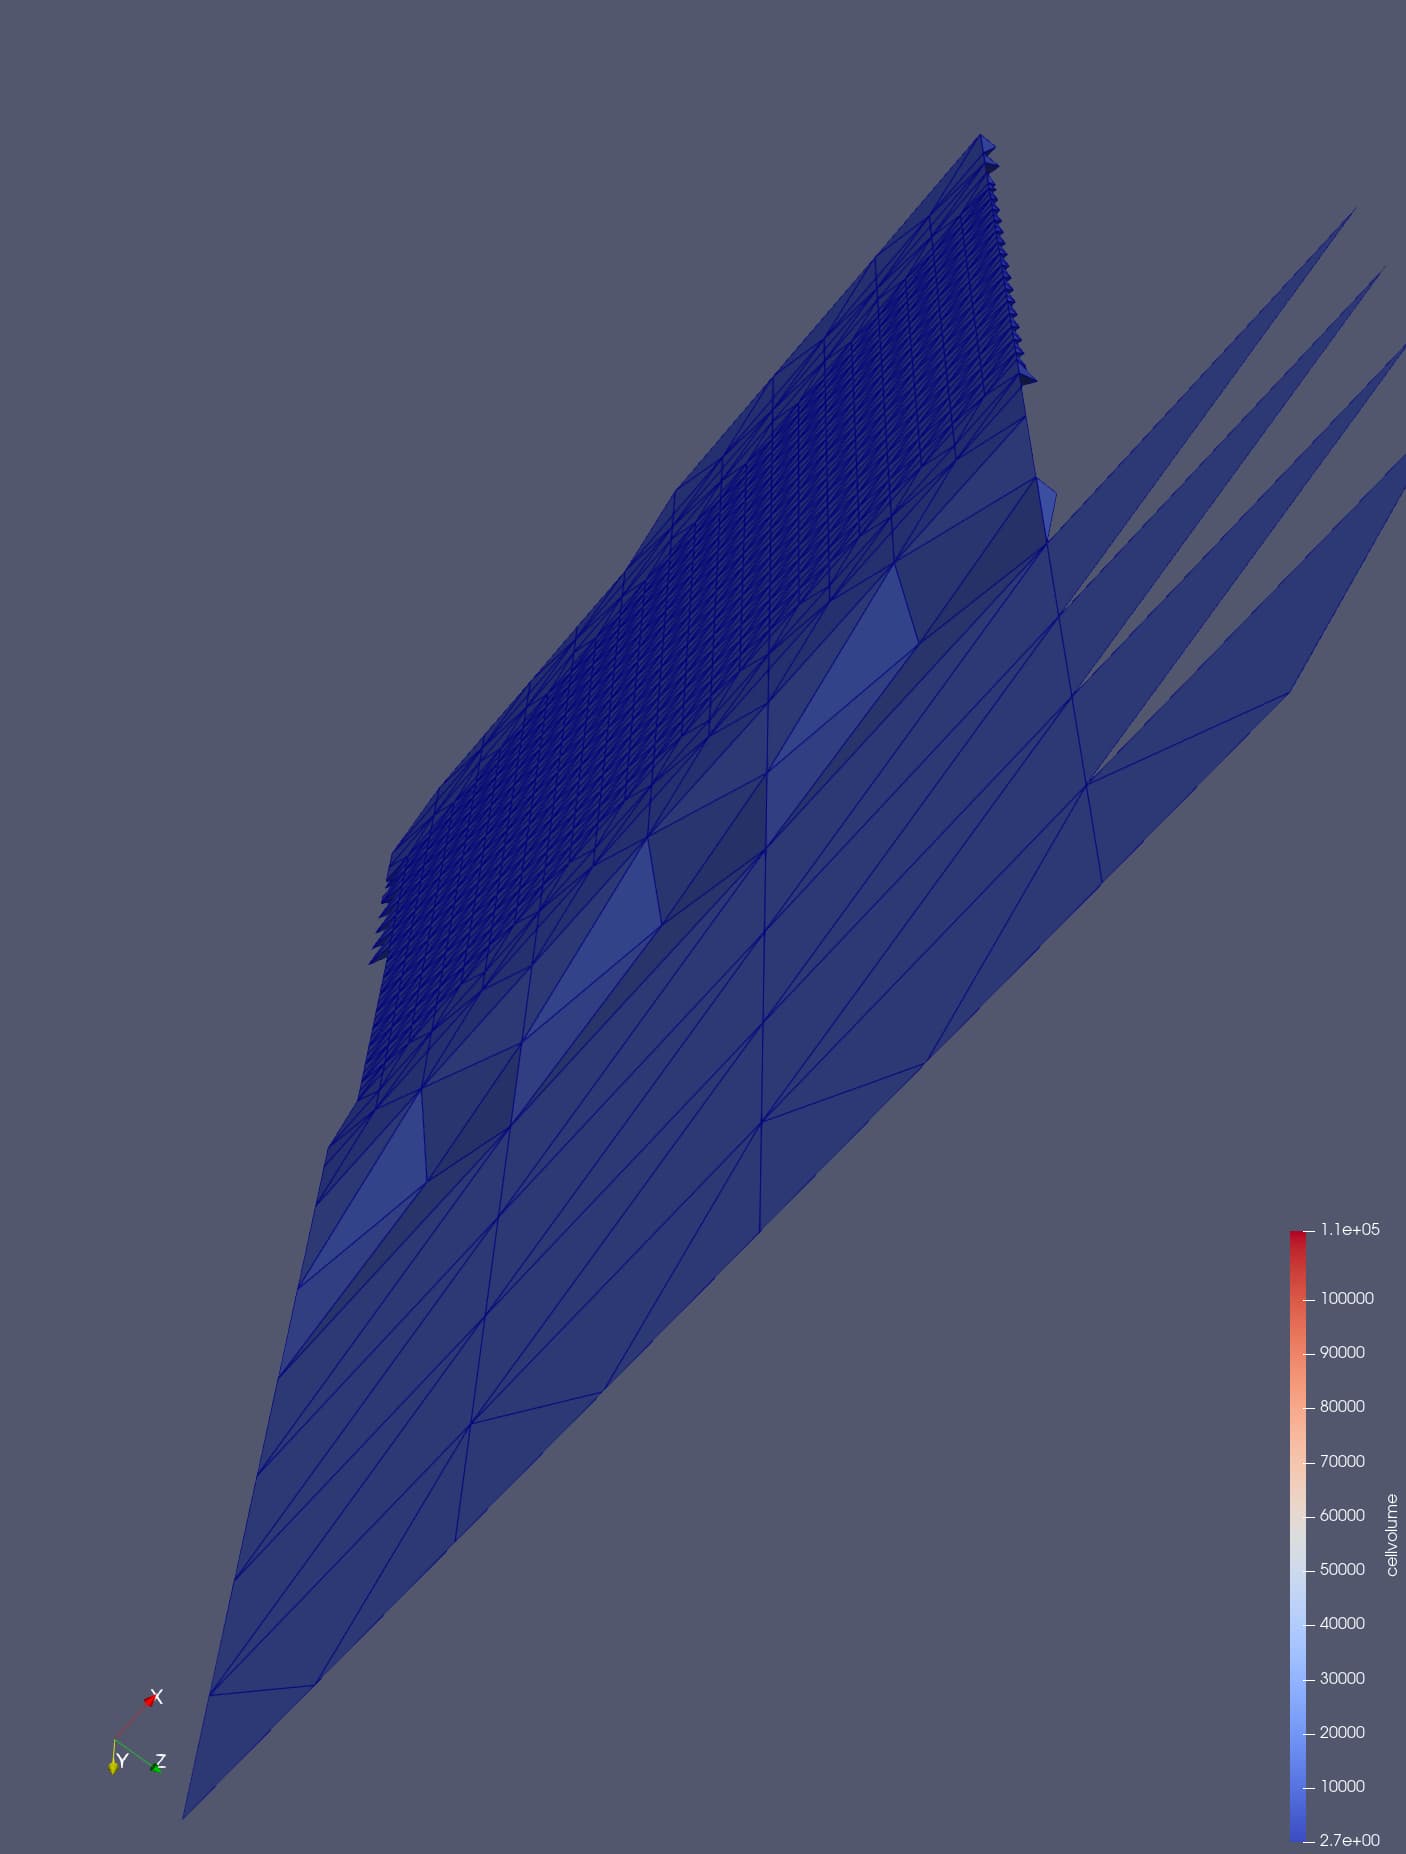
Thank you for your guidance. For the “T cell” you mean Tetrahedral cells right? Could you please let me know how can I get the mesh view in the screenshot so I investigate it further? Thanks.
There is a slightly redundant solution.
For the Slice surface, the Slice filter is used to cut and create a line for the plot. Then, the Plot On Sorted Lines filter is applied to the line, and the plot is now continuous.