Hello everyone,
I have a doubt when plotting over line.
My mesh is 16 levels in the Z direction and 4 meters deep, and some levels are spaced as shown below:
% Depht (m)
100 4
85 3.4
70 2.8
60 2.4
50 2
40 1.6
30 1.2
20 0.8
15 0.6
10 0.4
8 0.32
5 0.2
3 0.12
1 0.04
0.5 0.02
0 0
The quotation presented refers to the total depth.
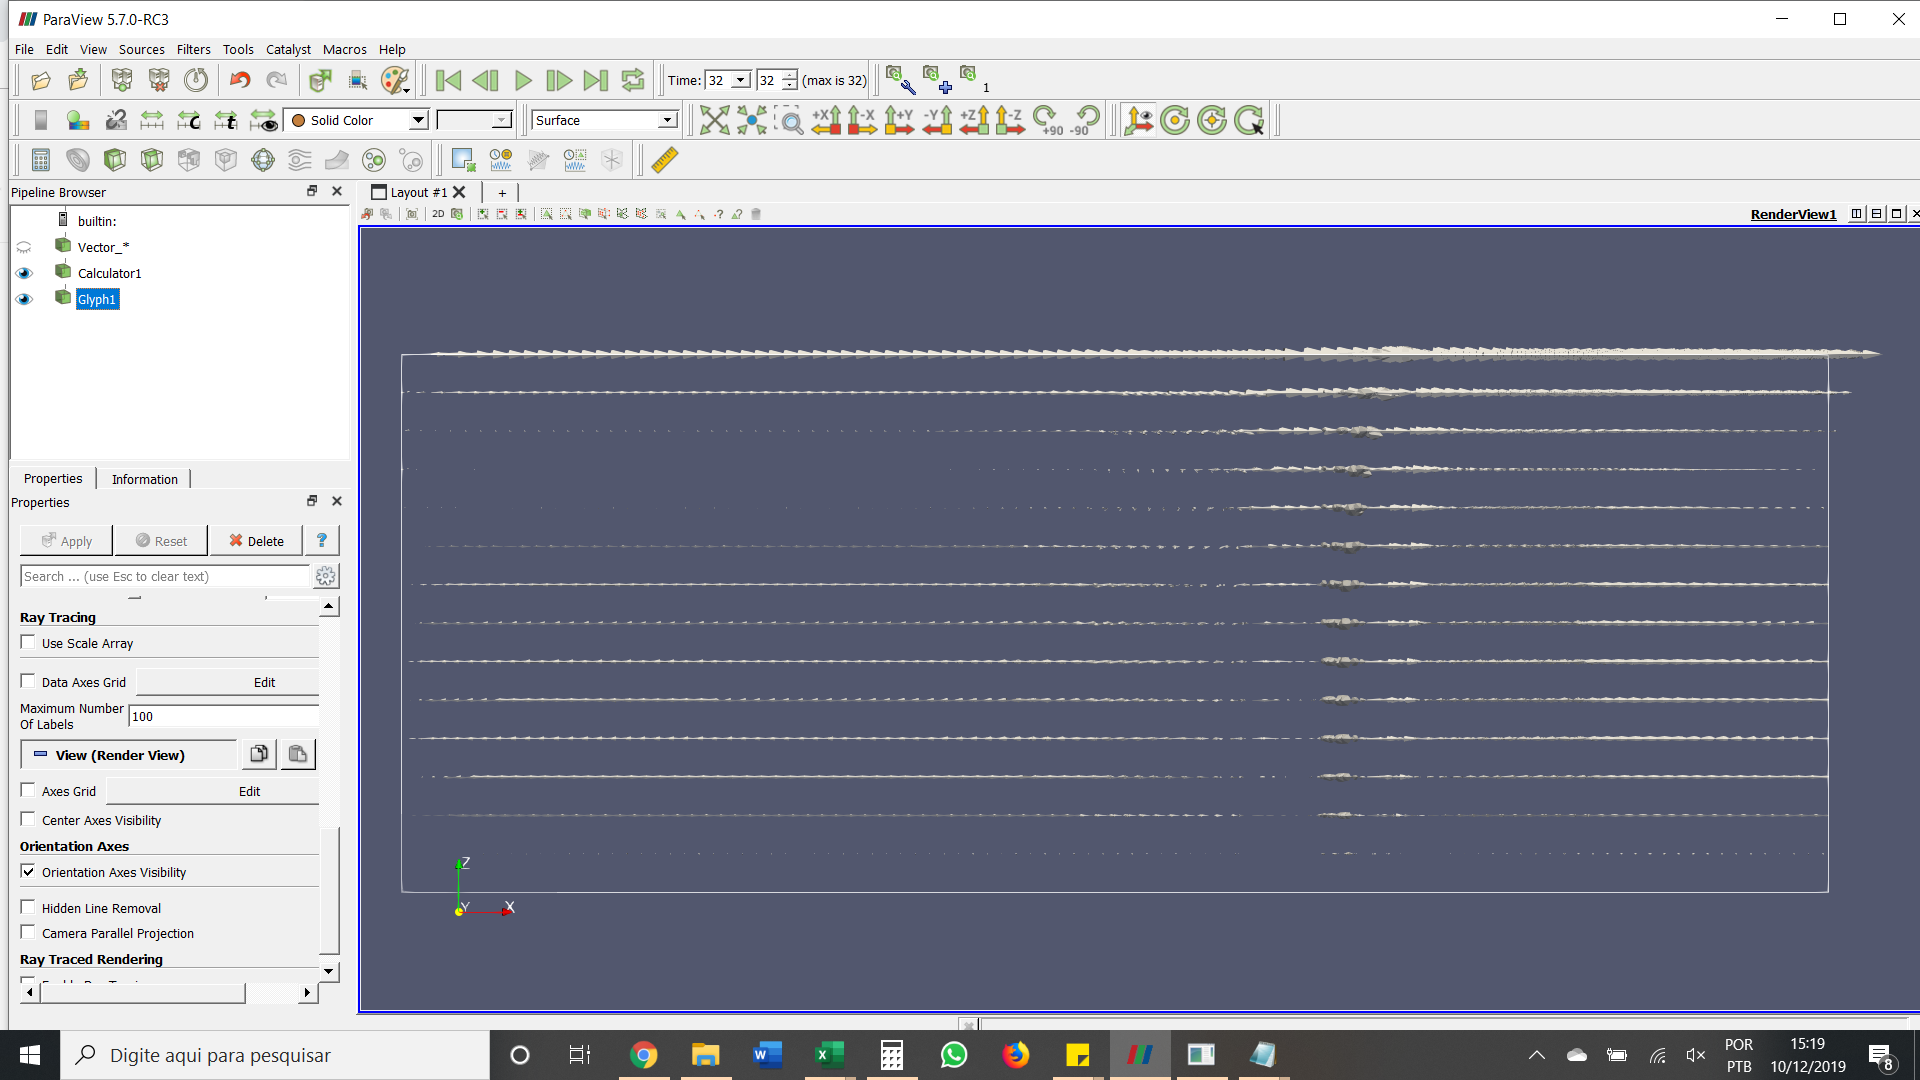
When I plot in the Z direction, the settings appear as follows.
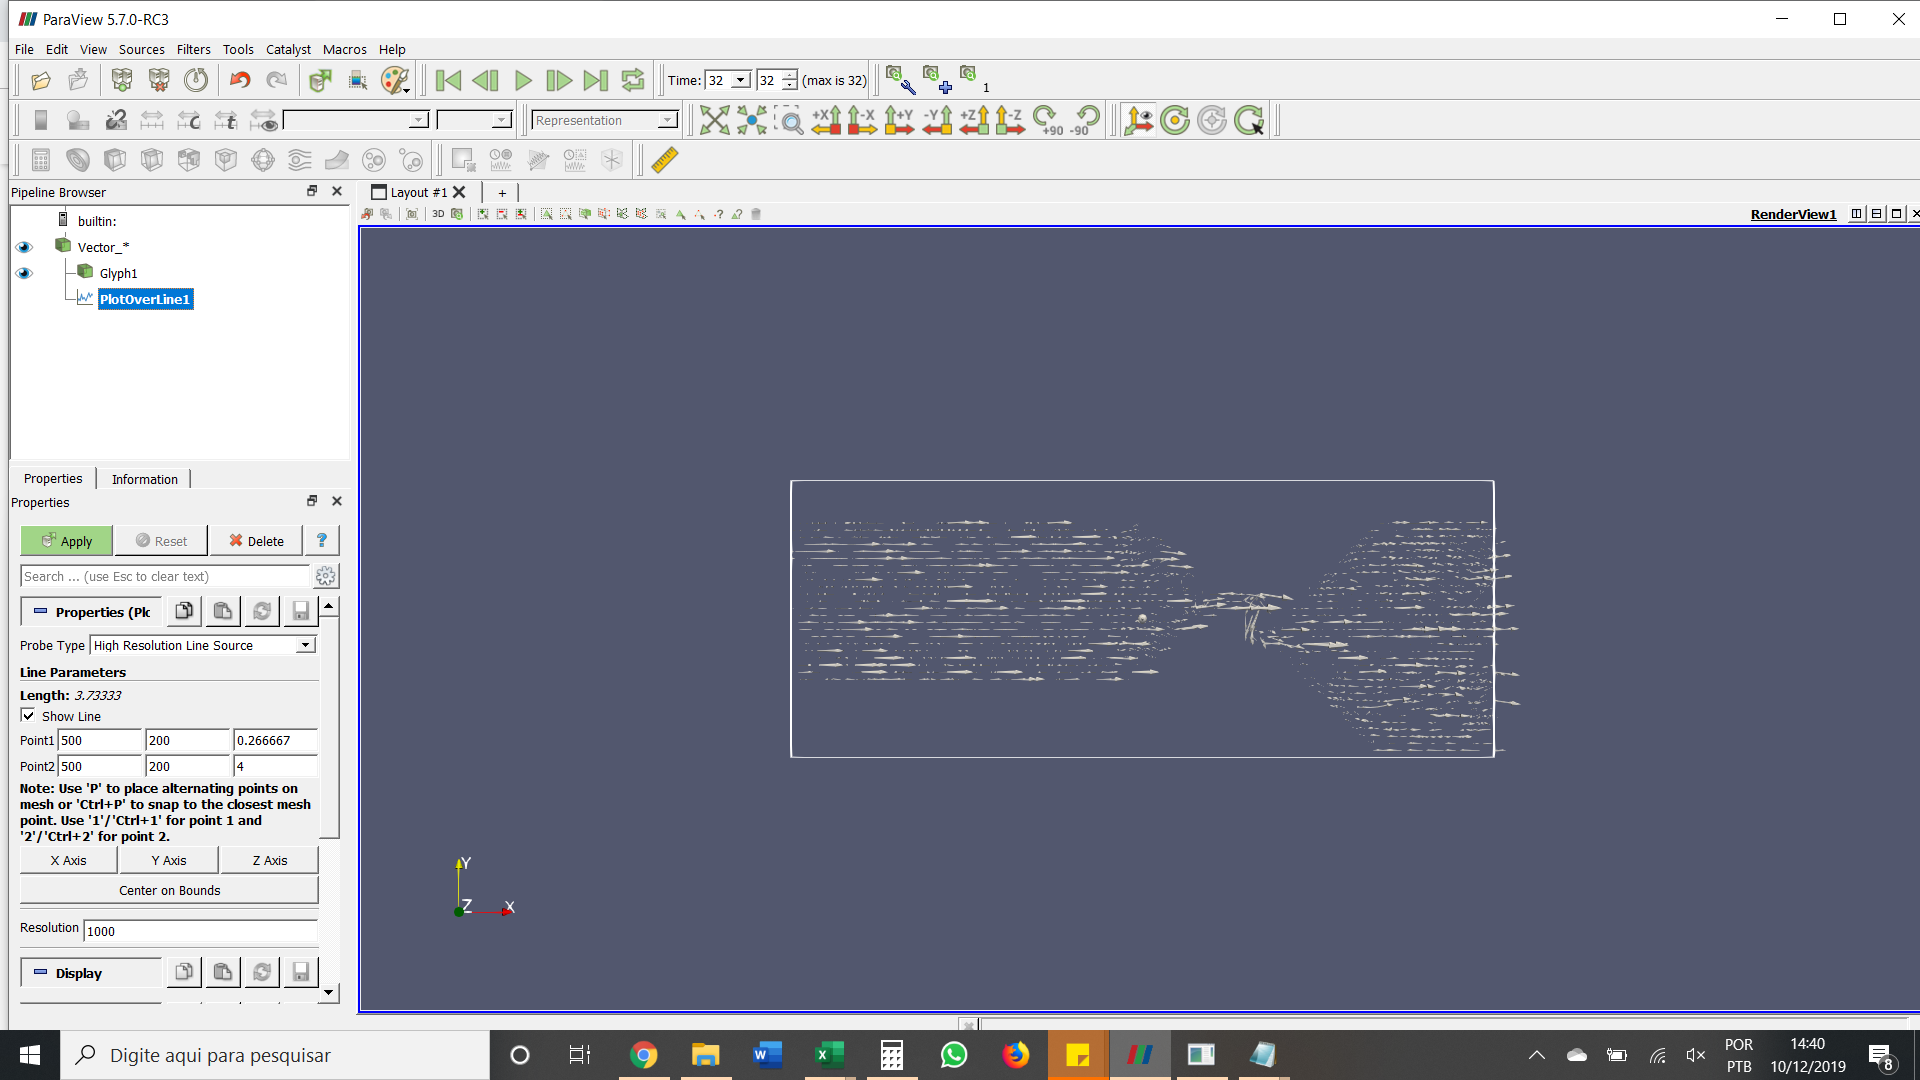
The first point is seen to start at 0.2667m. This corresponds to approximately 5% of the total depth. Points that are located in smaller percentages (0.5%, 1%, etc.) do not appear to be contact for the calculation.
Can anyone tell me if this is a limitation of Paraview, or if there is any lucar that I can edit?
When I set the starting point to zero, and export the data, the excel files look like this

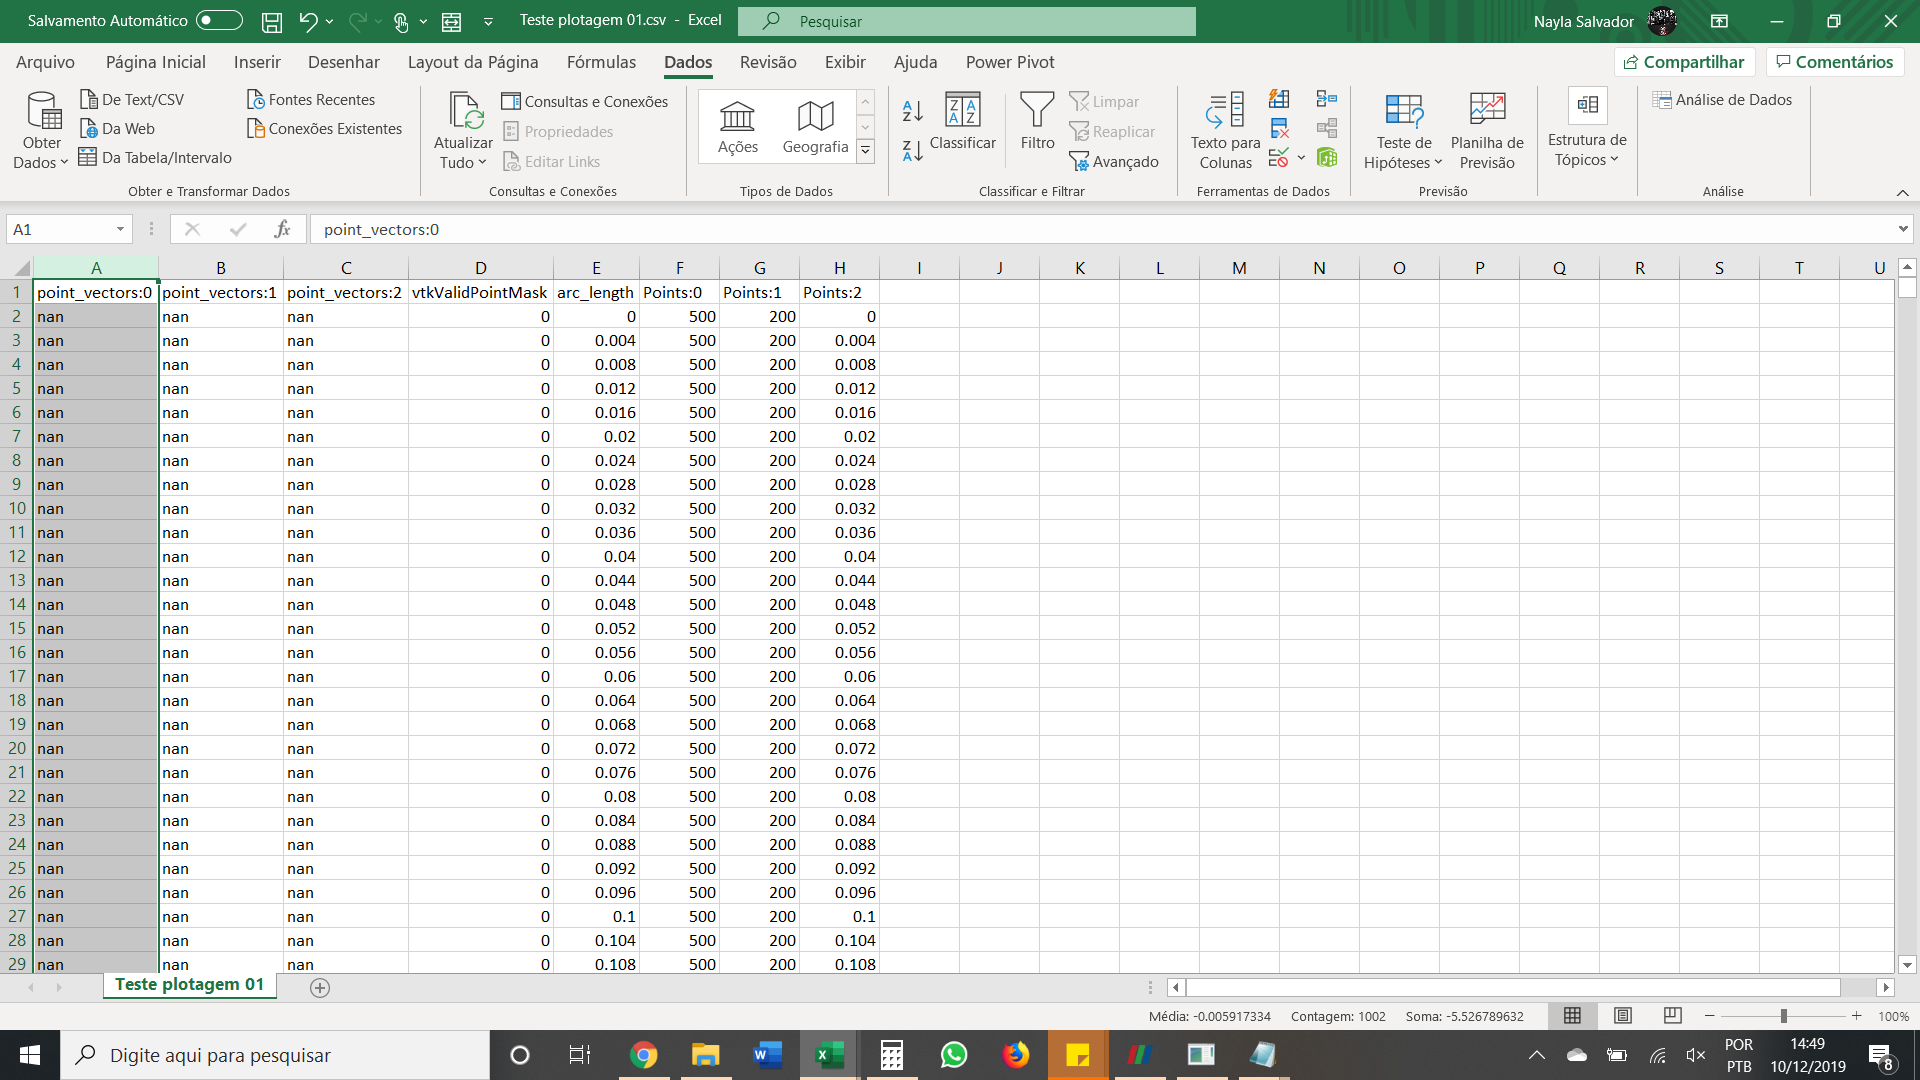
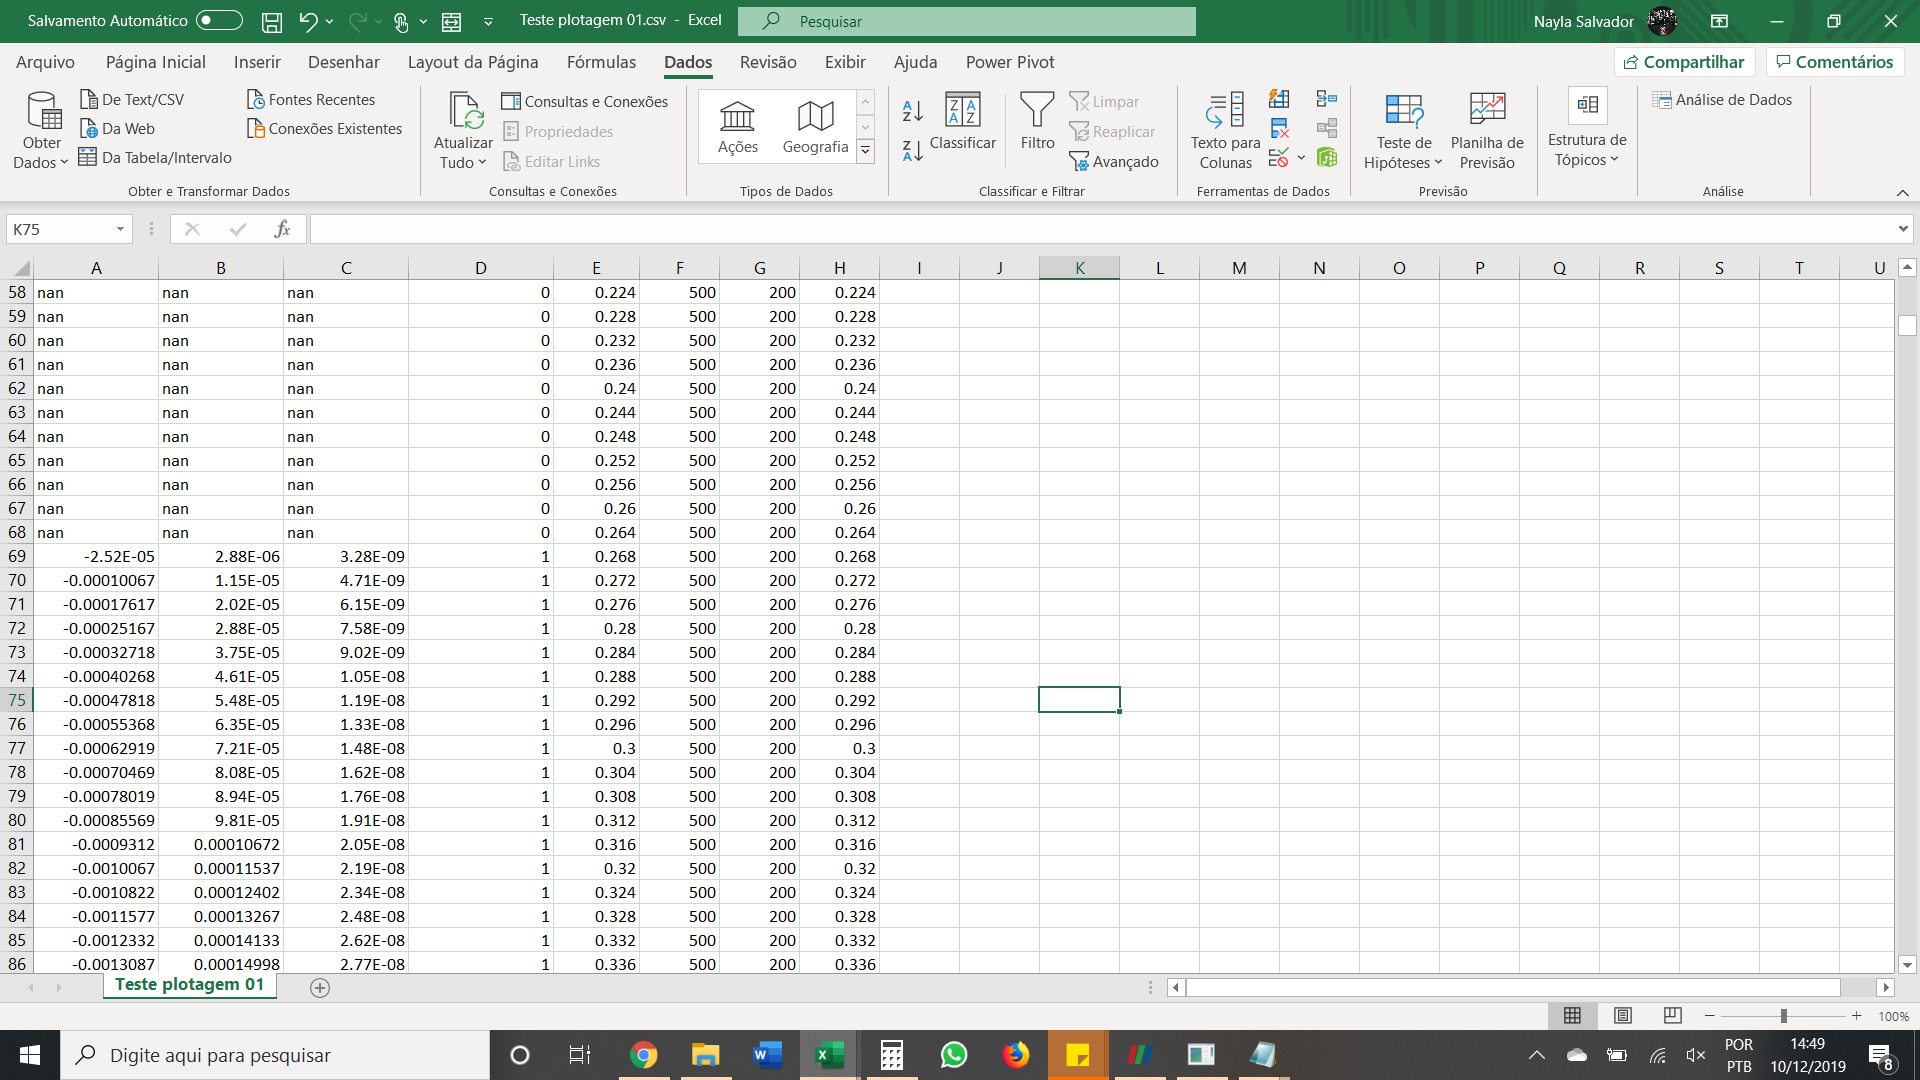
Speeds only appear after Z point 0.268,apparently there are 4 levels being ignored
Você quis dizer: [Na visualização aparece apenas 14 níveis](javascript:void(0))
41/5000
In the visualization only 14 levels appear