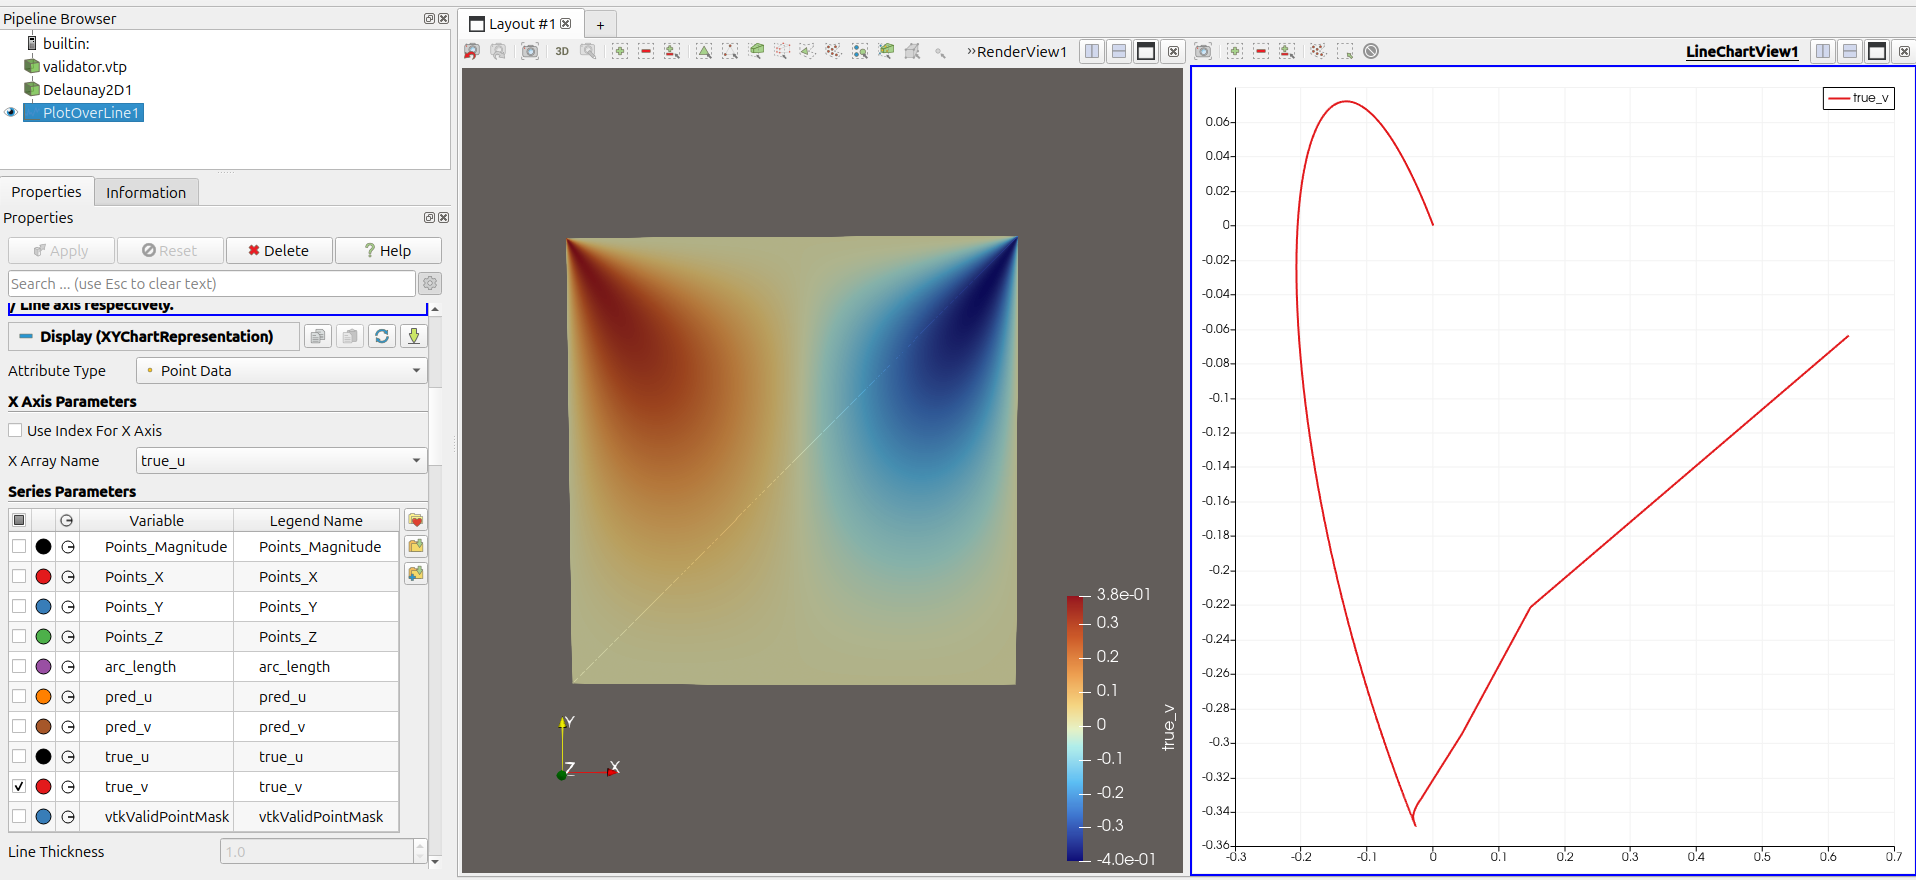
hi i have a file in vtp format. im new to paraview and i have some problems. i share here. when i use plot over line or any types of plot filters i dont know how to set my x and y axis data. for example i want to plot True_u data over center line of my domain. when i set plot over line filter the plot window shows nothing. please help me
First, when I try it on my side, nothing is displayed when I do a plot over line (probably because your vtp contains only vertices), I need first to compute a Delaunay2D.
To changes the array used in the X axis, you should go to the properties panel and found the X Array Name field under the Display category, here is what I have:
vtp files are commons but having only a point cloud (assuming all of your data is like the file that you shared) may not works with all filters, doing a Delaunay2D may be necessary in these cases.
In anycase, I recommend you to check this page : https://www.paraview.org/tutorials/, you’ll find different resources such as tutorials, webinar, etc…