Hello,
Is there any way that in a ‘Plot Over Line’ tool, the X axis is changed into Y axis?
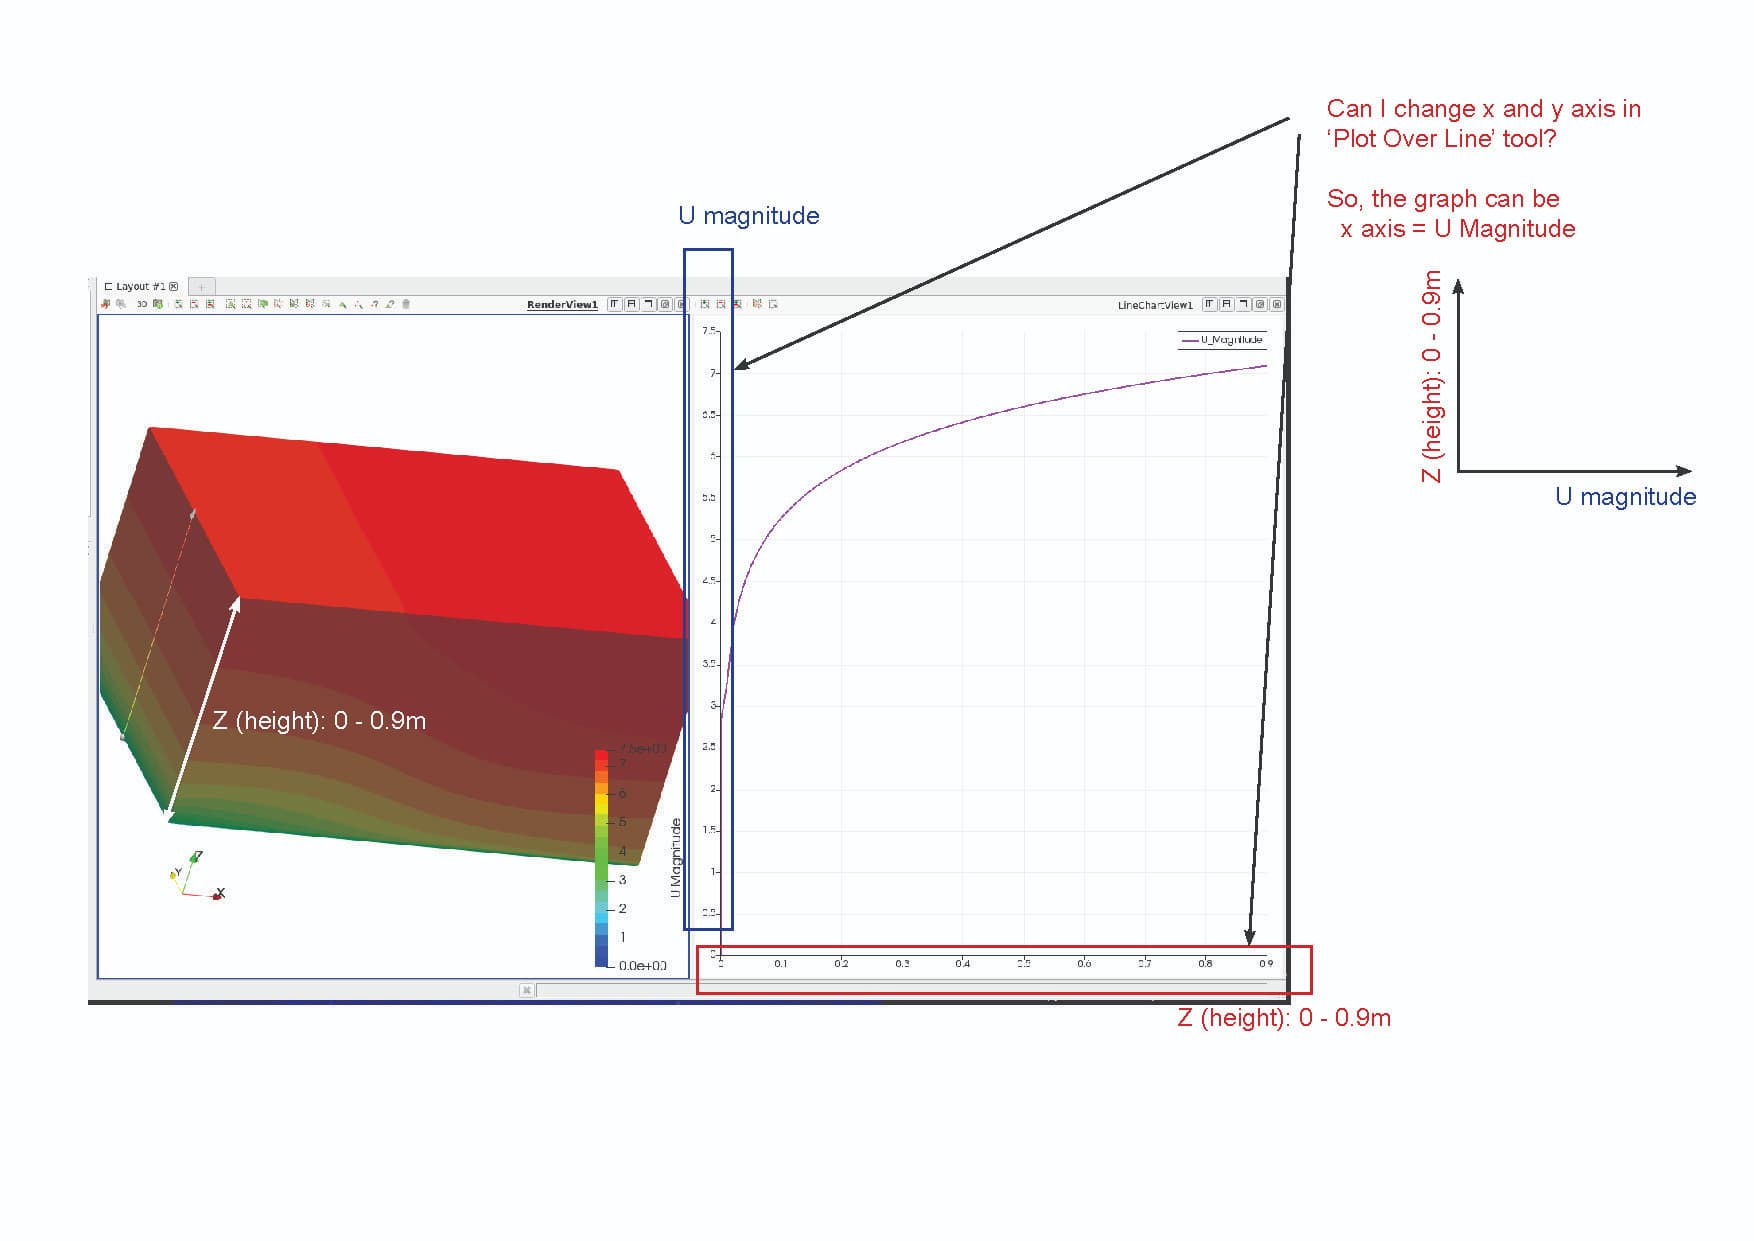
In the graph above by the Plot Over Line, the X axis represents Z (the height of geometry 0-0.9m) and the Y axis shows U Magnitude.
However, I would represent:
X = U Magnitude
Y = The height (m)
How can I change it?
Please help.
Thanks!