Hello!
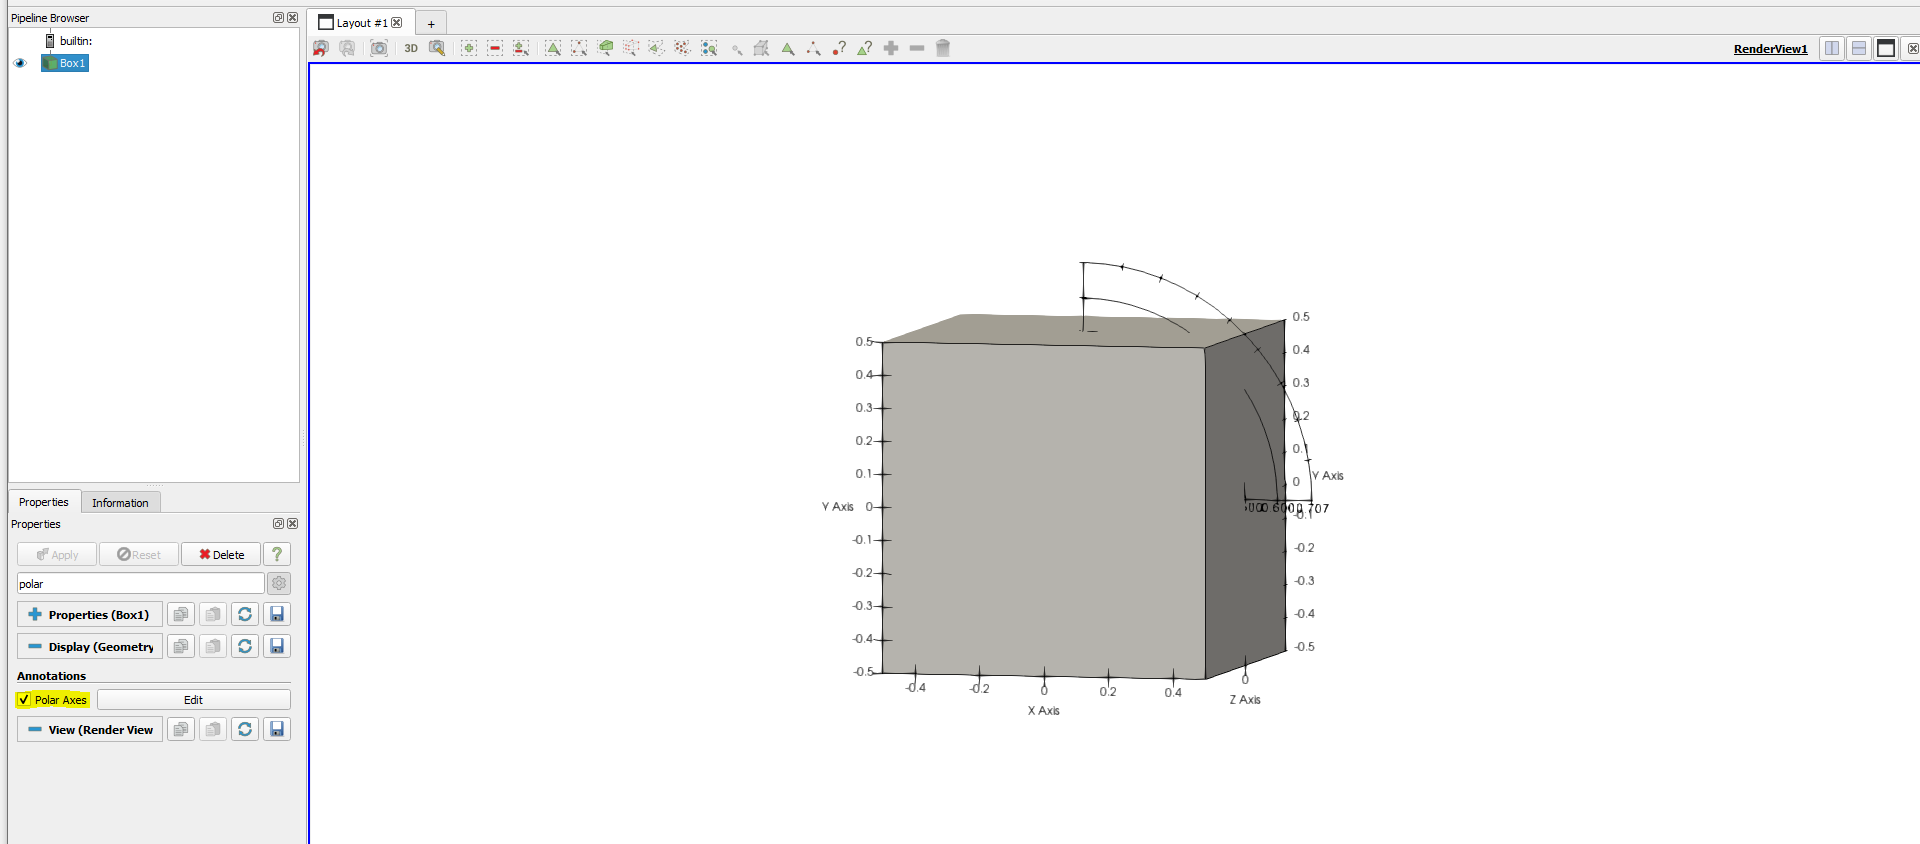
Suppose I have a box like this.
How could I make this data axes grid be in polar/cylindrical coordinates?
Kind regards
Enable Polar Axes ?
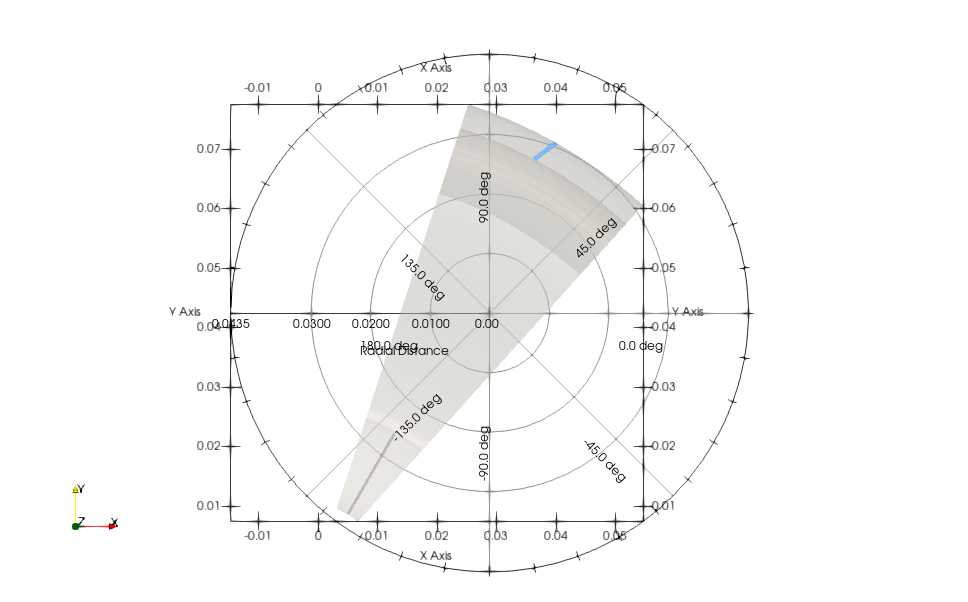
Polar axes are centered on the geometry as this is how it was designed. Your idea could be implemented though.
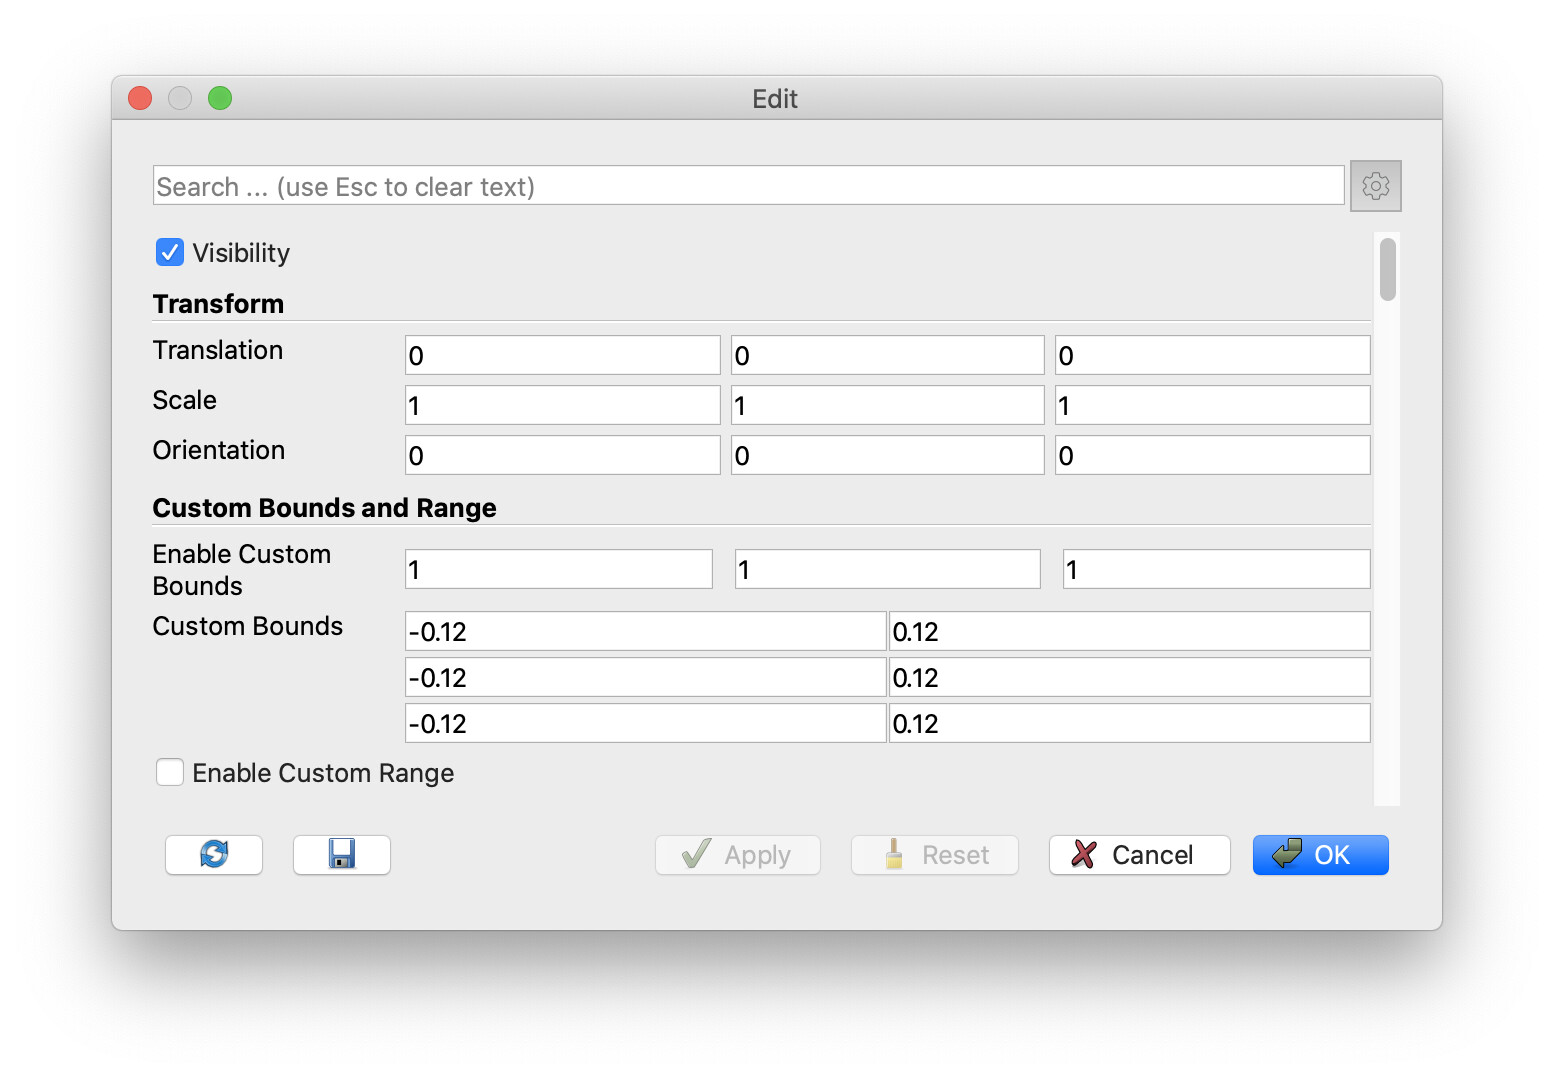
The polar coordinate parameters are a little screwy, but I think you can fix this problem by editing them. Hit the Edit button next to the Polar Axes checkbox to open the polar coordinate parameters. Turn on the advanced properties to edit the custom bounds. Change Enable Custom Bounds to 1, 1, 1 (why is this not just a checkbox?) and then change Custom Bounds to be minus and plus the radius of your data.
(On a side note, it would be better to ask this question on a new topic. This question is different than the original question asked.)
Nice! Thank you very much!
Ok, I will think about it next time to post on a new topic. Sorry, I am new here.