COMPRESION.pvsm (292.4 KB)
COMPRESION.rmed (2.4 MB)
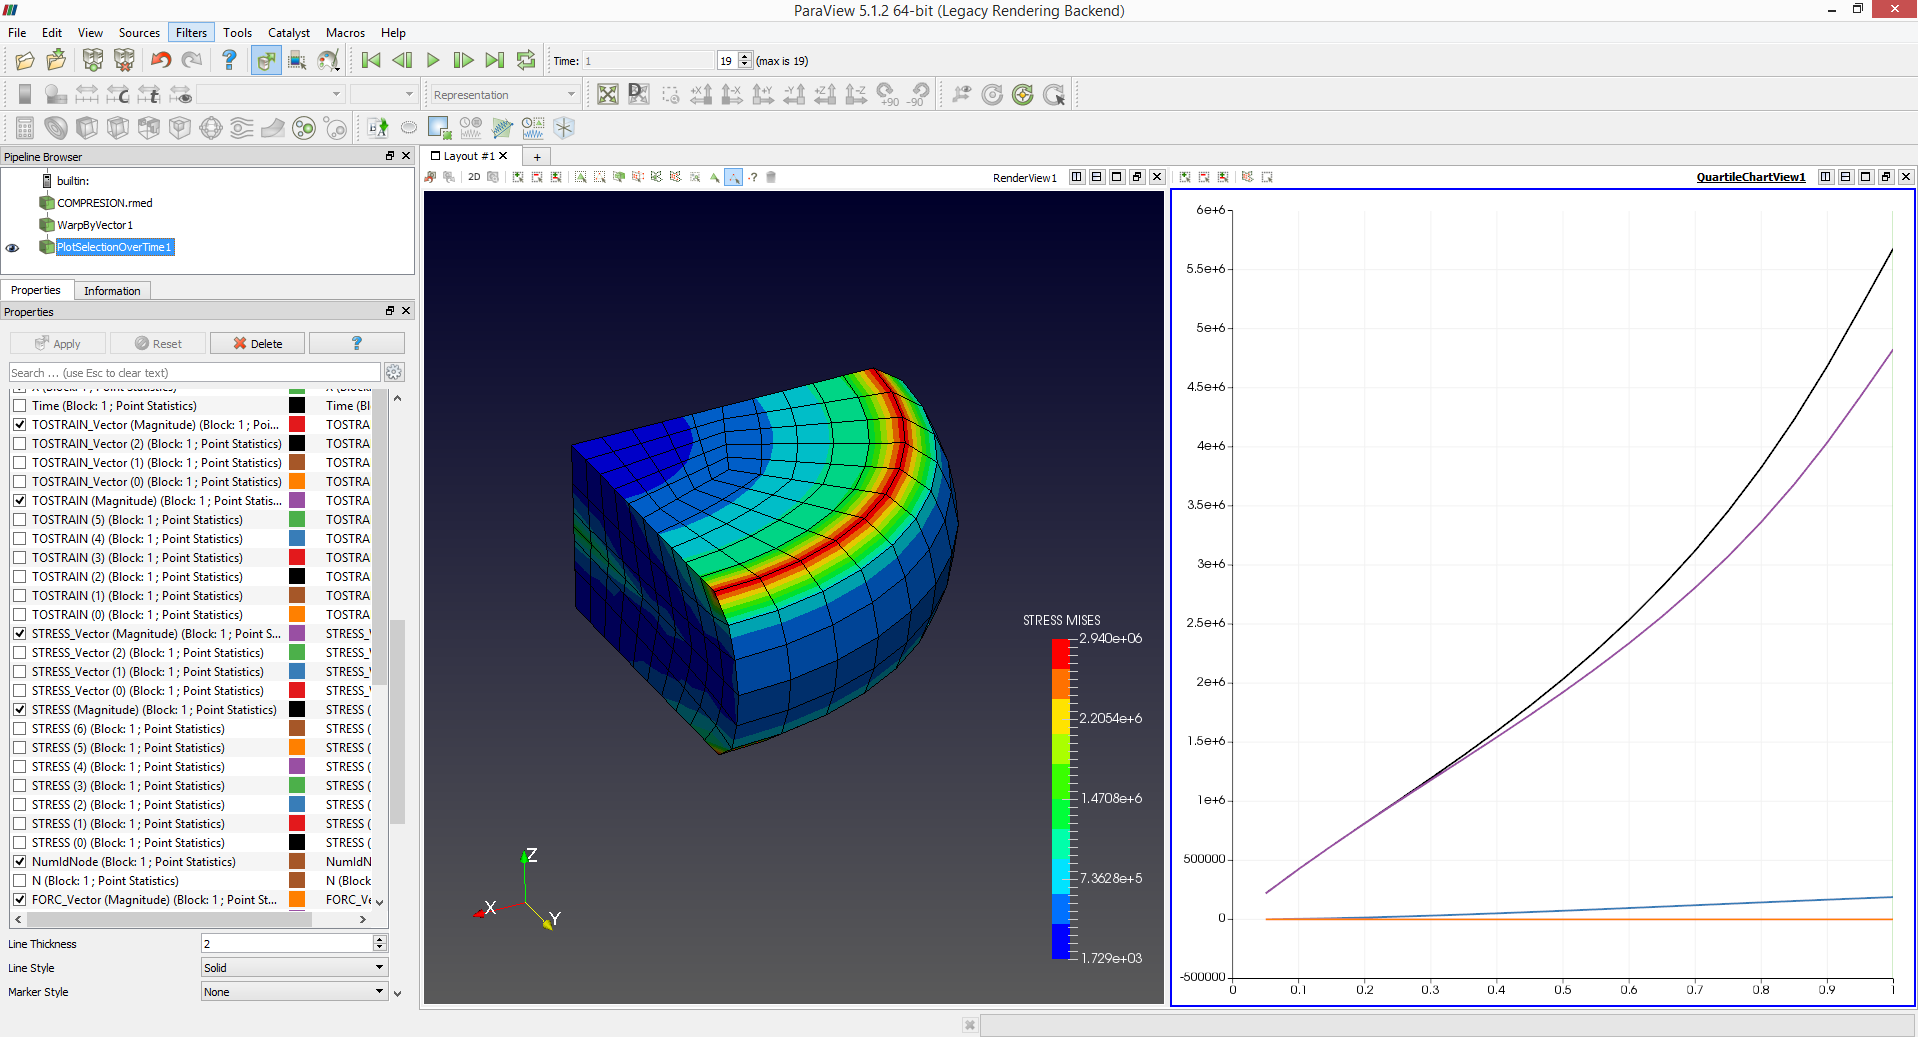
Hi, I have an .rmed file of a no lineal static analisys (solver was Calculix, results were converted from .frd using Calmed), were I can show the V. Misses stress, and would like also plot the V.Misses stress of one selected node (using interactive selection tool) with the filter Plot selection over time. My question is, why V.Misses variable doesn’t appear on the left list to plot??? I’m attaching the Paraview state file and the rmed file in case someone want to try it.
Best Regards