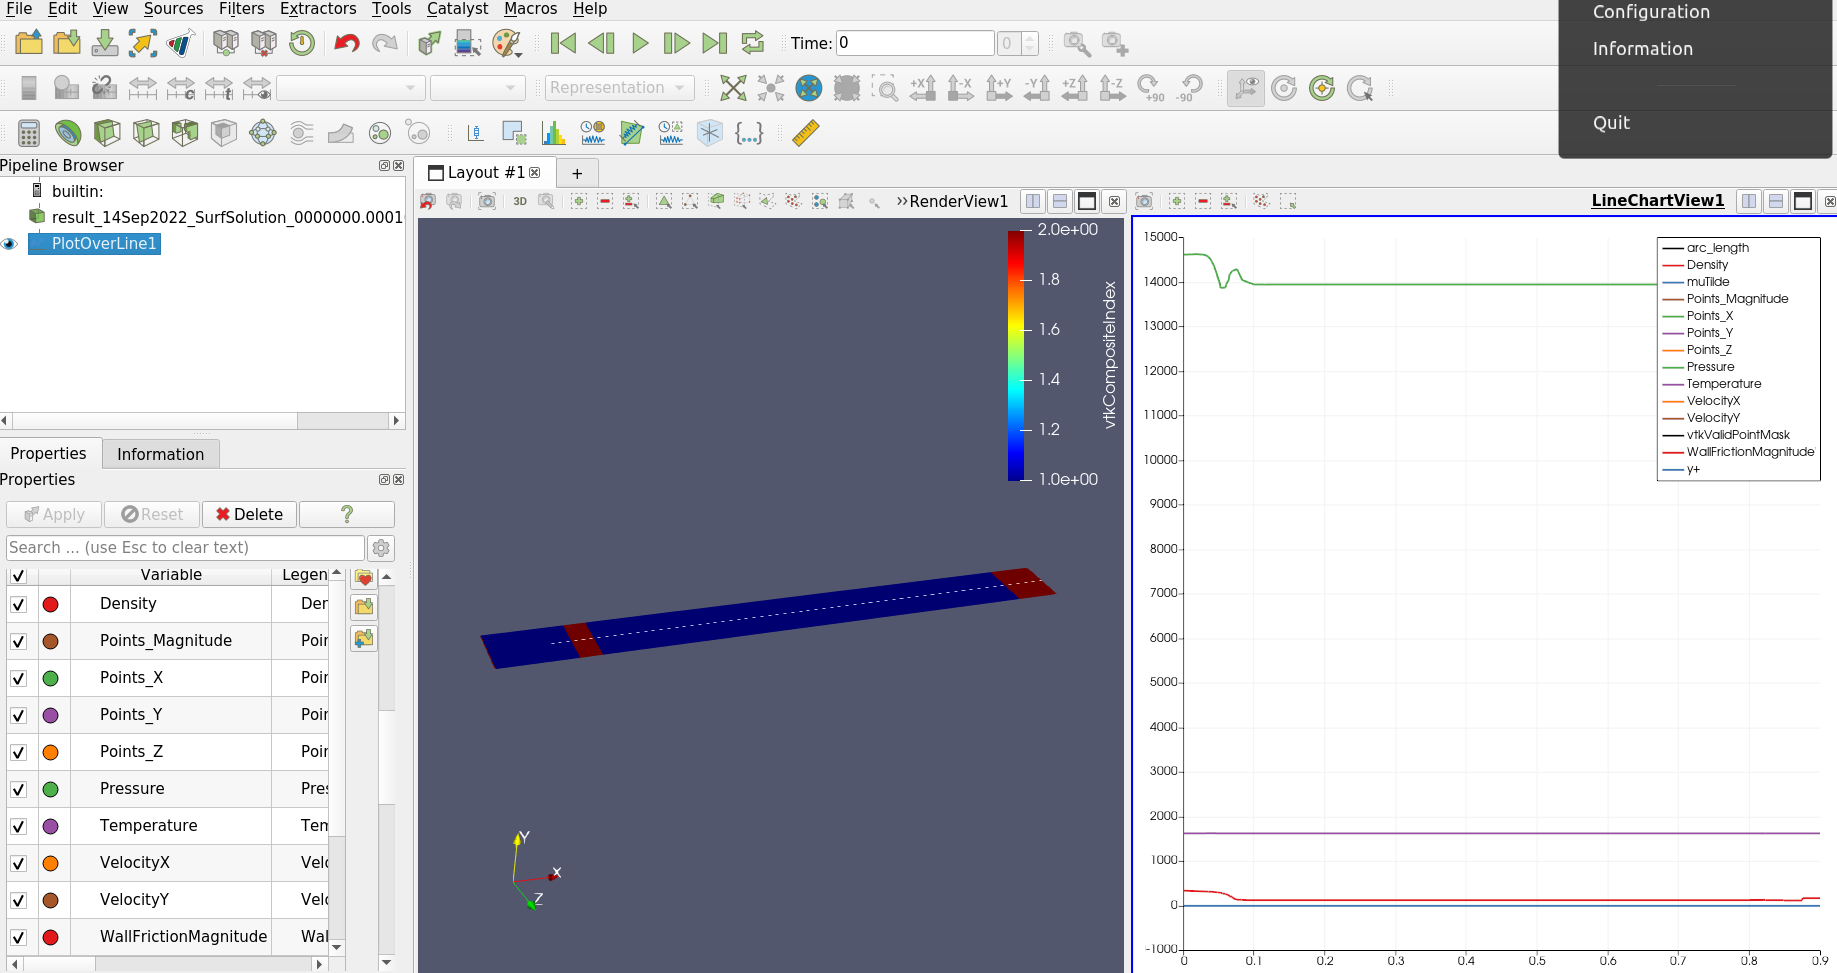
I have a 2d/3d composite dataset. Paraview allows coloring the surface/volume representation using vtkCompositeIndex (middle panel of the screenshot). However, when I apply a Plot Over Line filter, I am unable to visualise this same variable (right panel of the screenshot). Is it possible to do that?