Continuing the discussion from Plotting 2D contours using .txt or .dat file:
I am trying to plot contour plots using a .txt file. I am uploading the sample file containing data X, Y, VORTICITY_COMP, VORTICITY_EXACT. I want to plot Vorticity contours as a function of X and Y. I am attaching the data file to be plotted and expect results somewhat given in the figure. When I load the file, only the first 3 fields are loaded. How can I avoid this? How can these kinds of plots be plotted?
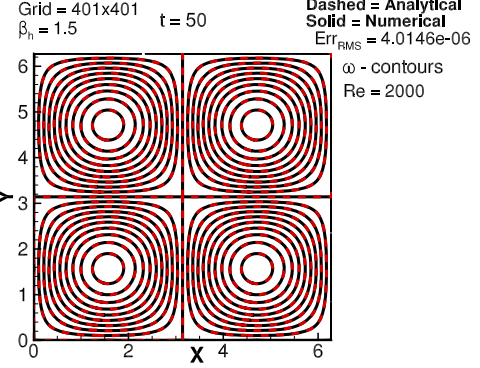
TGV Vorticity contours Re = 2000 t = 0.0.txt (5.3 KB)
When I load the file, only the first 3 fields are loaded.
In the TableToPoints filter options, 2D Points and Keep All Data Arrays must be enabled. Then, could you try the linked method you presented in your post?
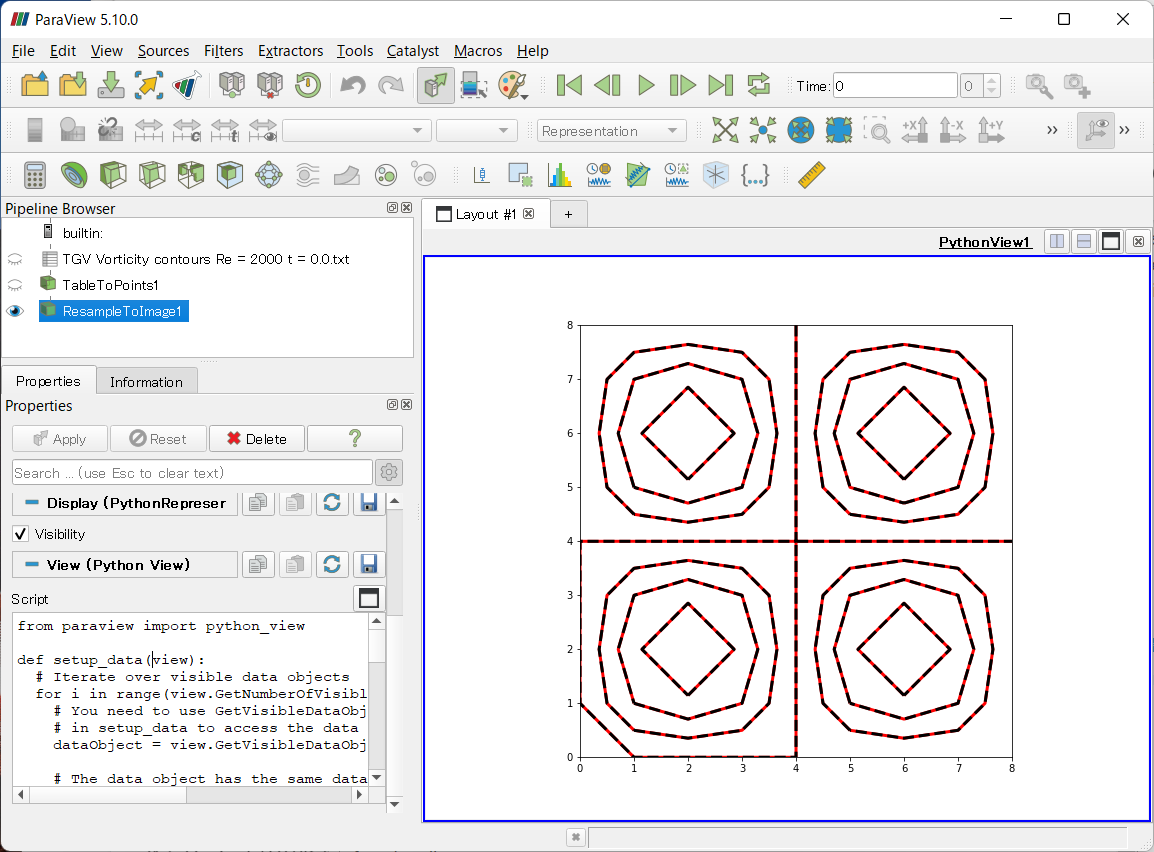
However, if you really want to decorate the contour lines with dashes, you may want to choose another tool, such as matplotlib, since ParaView does not seem to have that functionality.
Note that matplotlib can also be used from Python View within ParaView, as shown below. If you are interested in this, please refer to the following link and to the attached state file.
https://docs.paraview.org/en/latest/UsersGuide/displayingData.html#python-view
python_view.pvsm (39.9 KB)