I have a.CSV file, which contains coordinate data i.e X, Y, Z. Each coordinate has a mass M. I want to plot this mass for each coordinate in ParaView. Also,I want a color code for Mass.
Is there any way to do it?
I have attached the file too. Coordinate_w_Mass.csv (1.3 MB)
Ex: Say I have X : 1, Y : 2, Z : 3, Mass: 5. So the mass should be located at 1, 2,3.
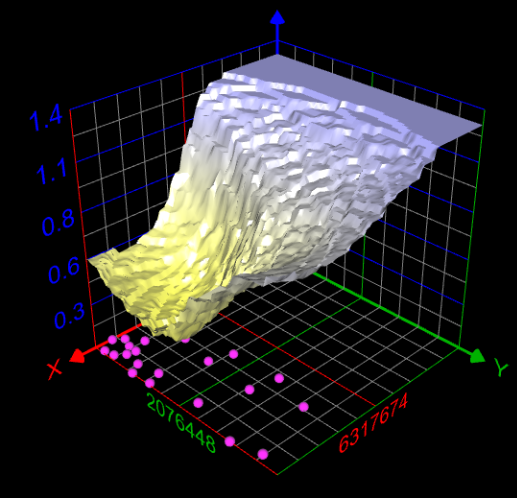
Hi I am working on the similar requirement. I have a CSV file with x y and z values.
I just need the meshgrid plot for this file using paraview. I did the import csv ->tabletopoints however I am not getting the required 3 D view. it is the csv for 6000 x 6000x 6000 points. Can you please guide to obtain the 3D view similar to just like in meshgrid. fig.