I am using Paraview 5.10.0-RC1. I have a .dat file containing values for 3 variables namely “Distance”, “U_comp”, “U_exact”. The 1st row has values of “Distance”, the 2nd has " U_comp" and the 3rd has “U_exact”. I want to plot U_comp Vs Distance and U_exact Vs Distance in a single plot but while uploading the .dat file it does not show various fields to be plotted or sometimes the application closes abruptly.
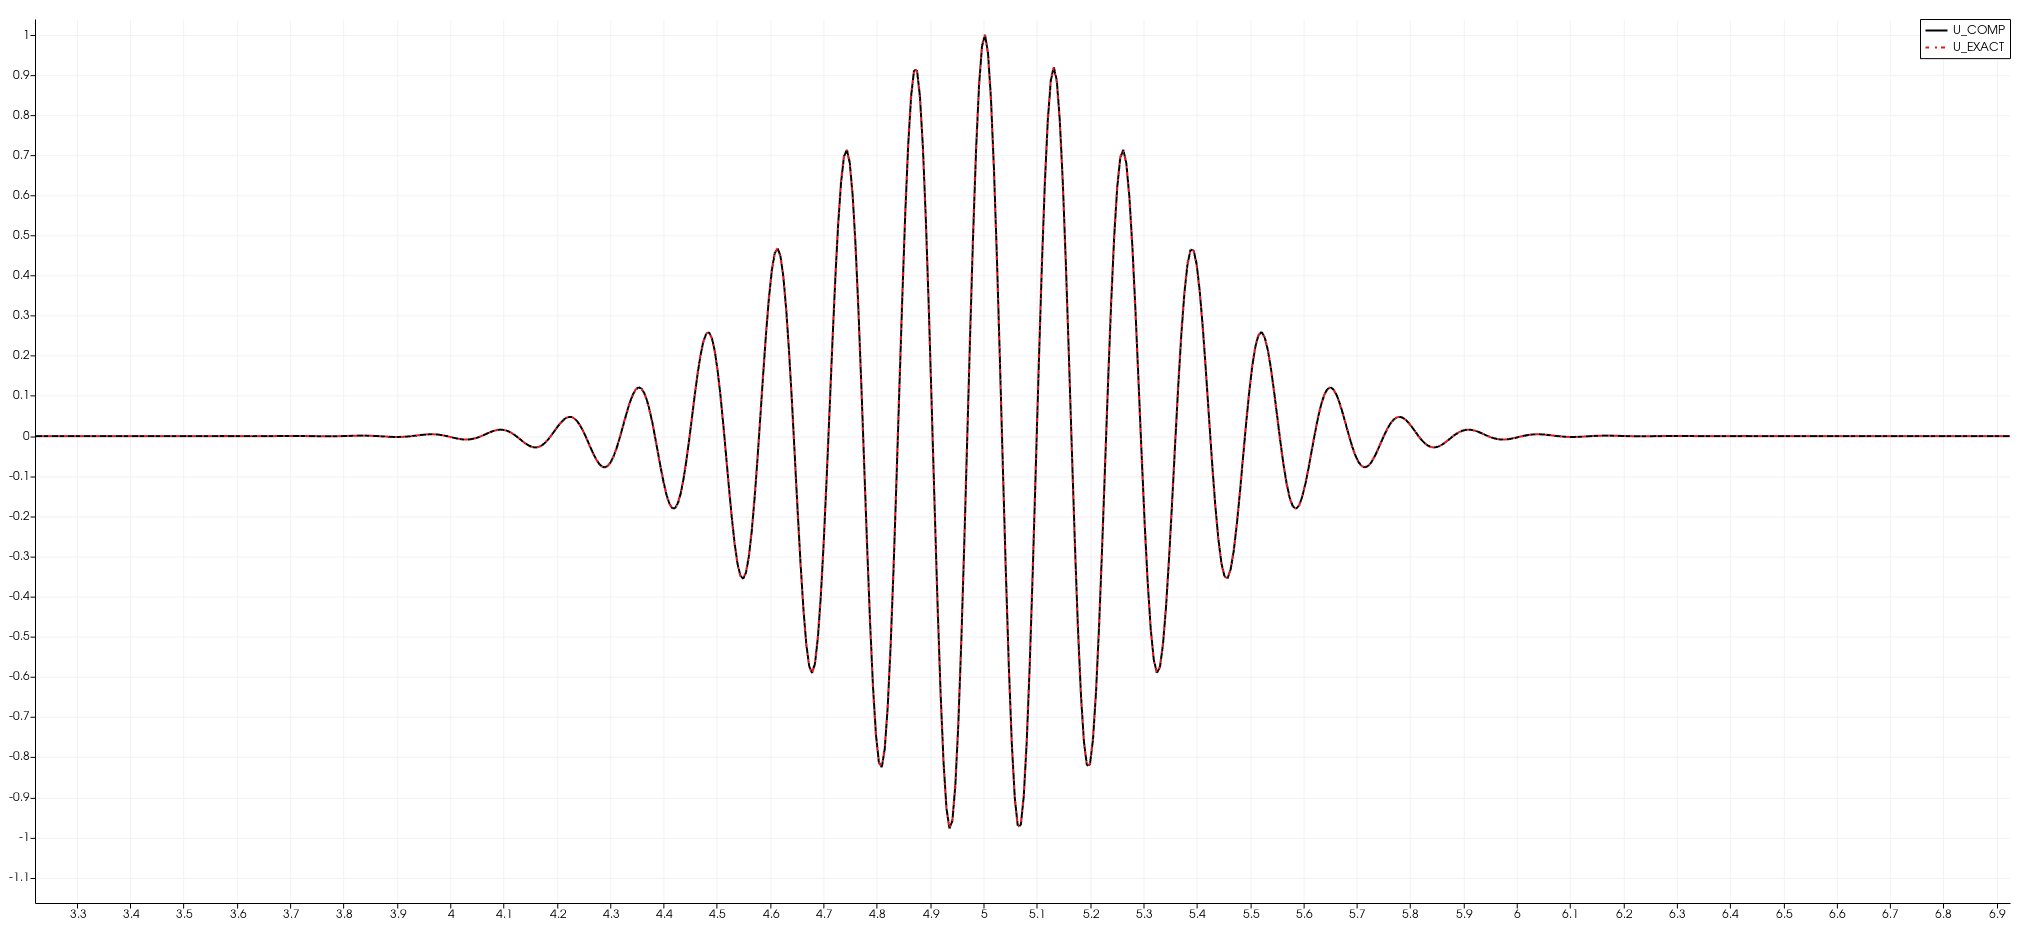
I want to get a plot something like this using Paraview:
I am attaching the .dat file for reference. If any change in the format of the file is needed, do suggest. Kindly also suggest how we can plot the data according to the above requirement. Any help would be appreciated. RK4-NUC6_wave_packet_(F-C-F)_beta1.5_t = 0.0.dat (403.3 KB)