Hi all,
I would like to plot individual segments, using a CSV file formatted as:
X1 Y1 Z1 X2 Y2 Z2 Intensity
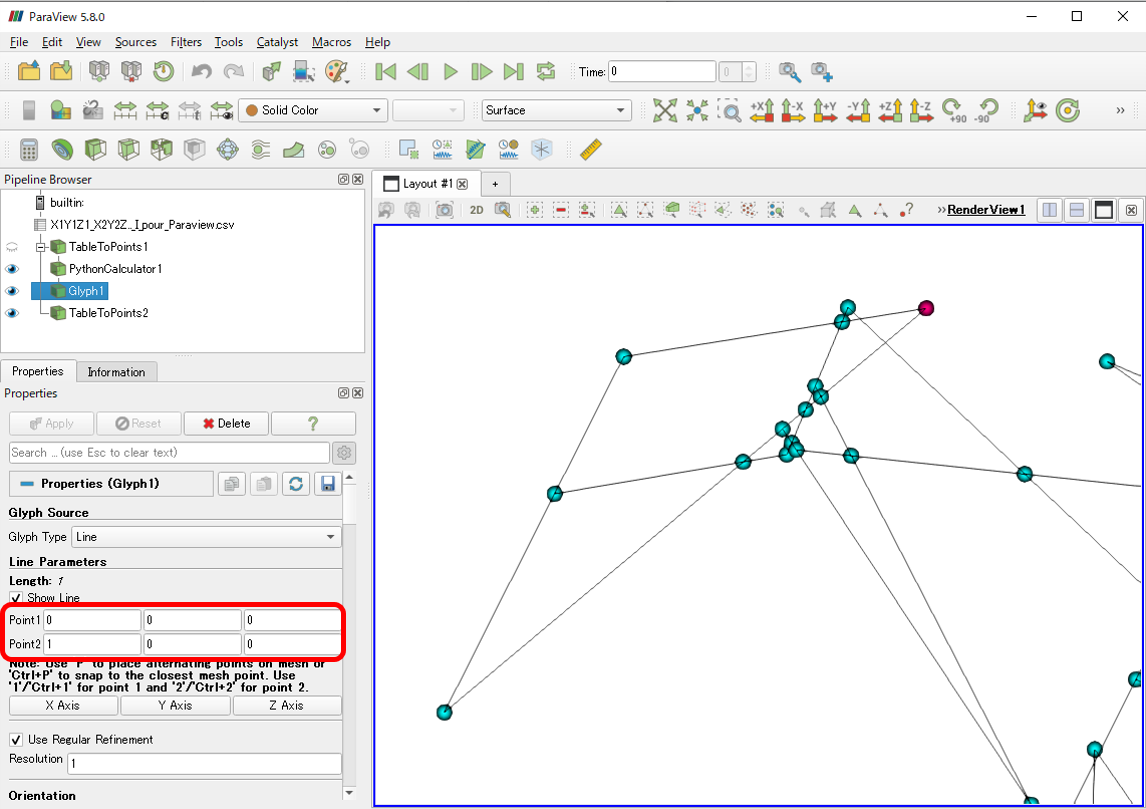
I managed to import the CSV file, then convert it using TableToPoints. Then, thanks to Python Calculator (How do I use three different arrays as components of one vector field?) , I built a V vector of coordinates (X2-X1,Y2-Y1, Z2-Z1). Finally, with Glyph filter, I am almost done, using the correct scaling, mimicking what I can obtain with GnuPlot (see attached picture: here data is simplified with Z1=Z2=0)

I guess I could use Line glyph type instead of Arrow, but then Line is “centered” on X1,Y1,Z1 point. How can I translate each glyph ?
(the other option I can think of use Arrow glyphes, without head and with the same diameter)
Using Paraview v5.8.0
Thank you for you help.
Nicolas
X1Y1Z1_X2Y2Z2_I_pour_Paraview.zip (141.9 KB)