Hi all,
I am new to Para View, and this forum. I have already done the first quarter of the tutorial and tried to find some answers in the Internet but I was not very successful. I am using Para View 5.8.0 on Manjaro Kyria 19.0.2.
I want to plot the output of the NCAR TIE-GCM (Thermosphere-Ionosphere-Electrodynamics General Circulation Model).
The output is saved in netCDF files following the CF-Conventions (CF-1.0). The fields are given on spherical coordinates: latitude, longitude and pressure scale height as vertical component. When choosing 5 degree resolution the netcdf file has the following entries (extract):
dimensions:
    time = UNLIMITED;   // (4 currently)
    lon = 72;
    lat = 36;
    ilev = 29;
variables:
    double time(time=4);
        :long_name = "time";
        :units = "minutes since 2004-3-20 0:0:0";
        :initial_year = 2004; // int
        :initial_day = 80; // int
        :initial_mtime = 80, 0, 0; // int
    double lon(lon=72);
        :long_name = "geographic longitude (-west, +east)";
        :units = "degrees_east";
        :standard_name = "longitude";
    double lat(lat=36);
        :long_name = "geographic latitude (-south, +north)";
        :units = "degrees_north";
        :standard_name = "latitude";
    double ilev(ilev=29);
        :long_name = "interface levels";
        :short_name = "ln(p0/p)";
        :units = "";
        :positive = "up";
        :standard_name = "atmosphere_ln_pressure_coordinate";
        :formula_terms = "p0: p0 lev: ilev";
        :formula = "p(k) = p0 * exp(-ilev(k))";
        :computed_standard_name = "air_pressure";
    float NE(time=4, ilev=29, lat=36, lon=72);
        :long_name = "ELECTRON DENSITY";
        :units = "cm-3";
        :missing_value = 1.0E36; // double
    float ZG(time=4, ilev=29, lat=36, lon=72);
        :long_name = "Geometric Height ZG";
        :units = "cm";
        :missing_value = 1.0E36; // double
I have successfully opened a corresponding dataset using the ‘NetCDF Reader’, but I have some questions
-
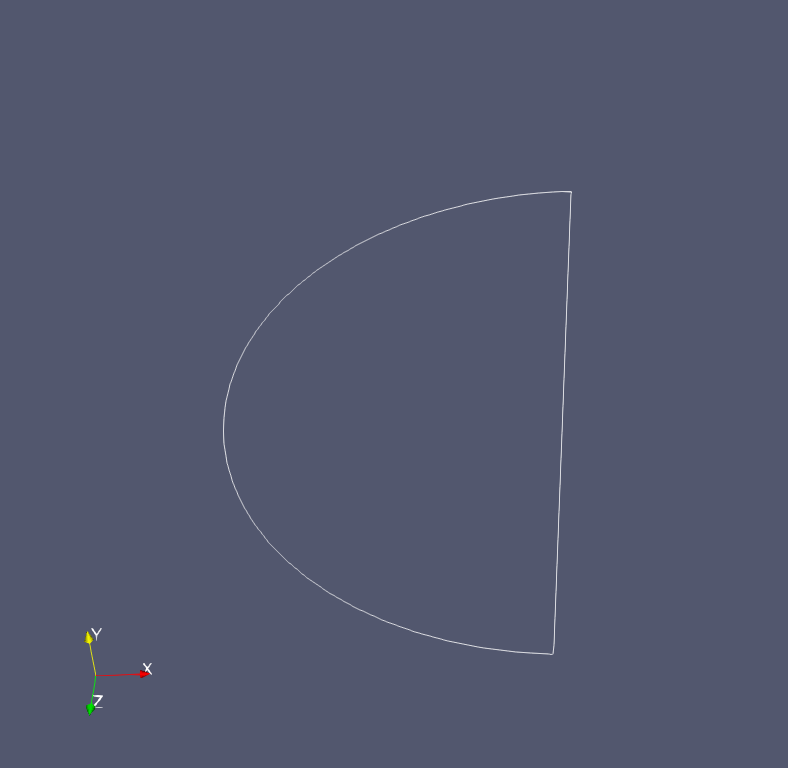
Representation
If I choose ‘outline’ the boundary is a semicircle. I would expect a sphere
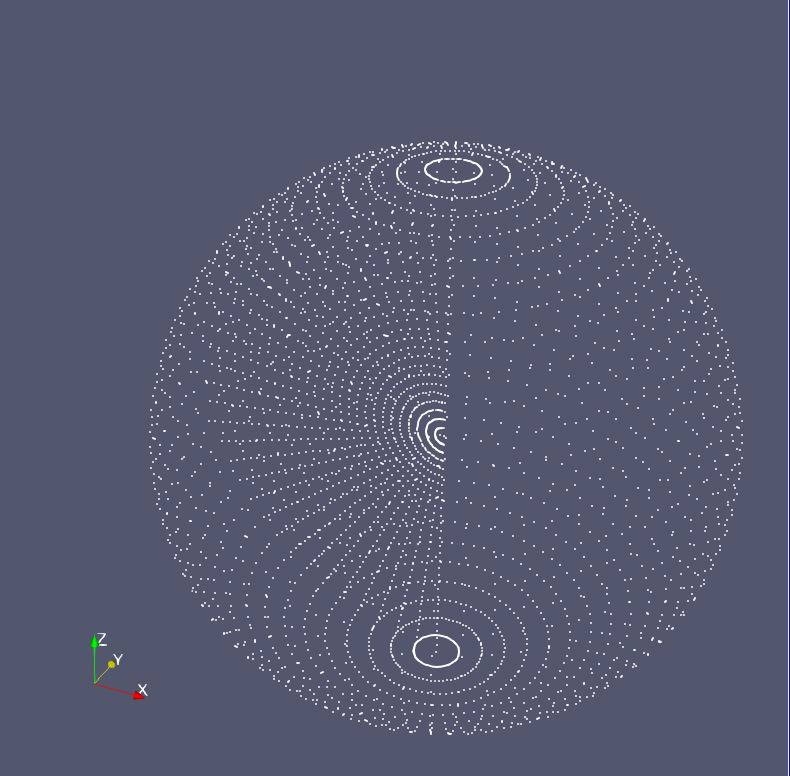
When changing the representation to ‘points’, only a slice of all internal points is shown. Why are not all points plotted?
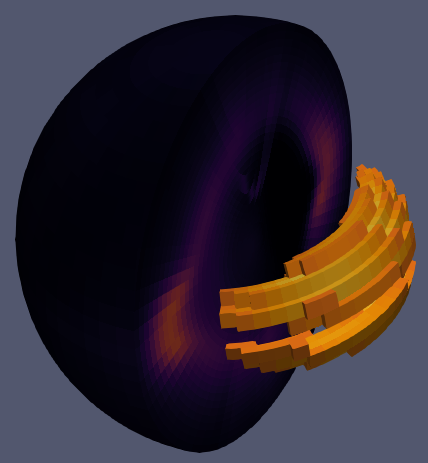
However, surface plots are working as expected
-
Vertical Coordinate
I would like to use the geometric height (field ZG ) as vertical coordinate instead of the pressure scale height. There is the filter ‘Warp by Vector’ which probably can do this. But ZG is a 4D scalar field and not a vector field. Of course I can compute the cartesian coordinates from ZG, latitude and longitude, and include them in the netcdf file, but Para View can not open 5D variables (lat,lon,time,ilev,dim vector). I get the error message:ERROR: In /build/paraview/src/ParaView-v5.8.0/VTK/IO/NetCDF/vtkNetCDFReader.cxx, line 761 vtkNetCDFCFReader (0x55cbbdb74b30): More than 3 dims + time not supported in variable
I have tried ‘Warp by Scalar’ but all points are then shifted a long the the same axis.
So is there a way to use the geometric coordinates using Para View?
-
Contour
After applying the ‘Cell Data to Point Data Filter’ it is possible to use the contour filter.
But I get the following error message:Generic Warning: In /build/paraview/src/ParaView-v5.8.0/VTK/Common/Core/vtkMath.cxx, line 1314 Unable to factor linear system Generic Warning: In /build/paraview/src/ParaView-v5.8.0/VTK/Filters/Core/vtkGridSynchronizedTemplates3D.cxx, line 295 Cannot compute gradient of grid
Are there other ways to solve these problems, e.g., converting the netcdf file to a different format?
Thanks a lot for your help!
