Hello All,
I have a file in csv format which has x, y, z, and resistivity. I want to display this data in 3D in paraview. I will appreciate if anyone can help me out.
Thank you.
Here is the example of the data:
Resistivity data.csv (46.3 KB)
Hello All,
I have a file in csv format which has x, y, z, and resistivity. I want to display this data in 3D in paraview. I will appreciate if anyone can help me out.
Thank you.
Here is the example of the data:
Resistivity data.csv (46.3 KB)
Hi Seun and welcome to the forum !
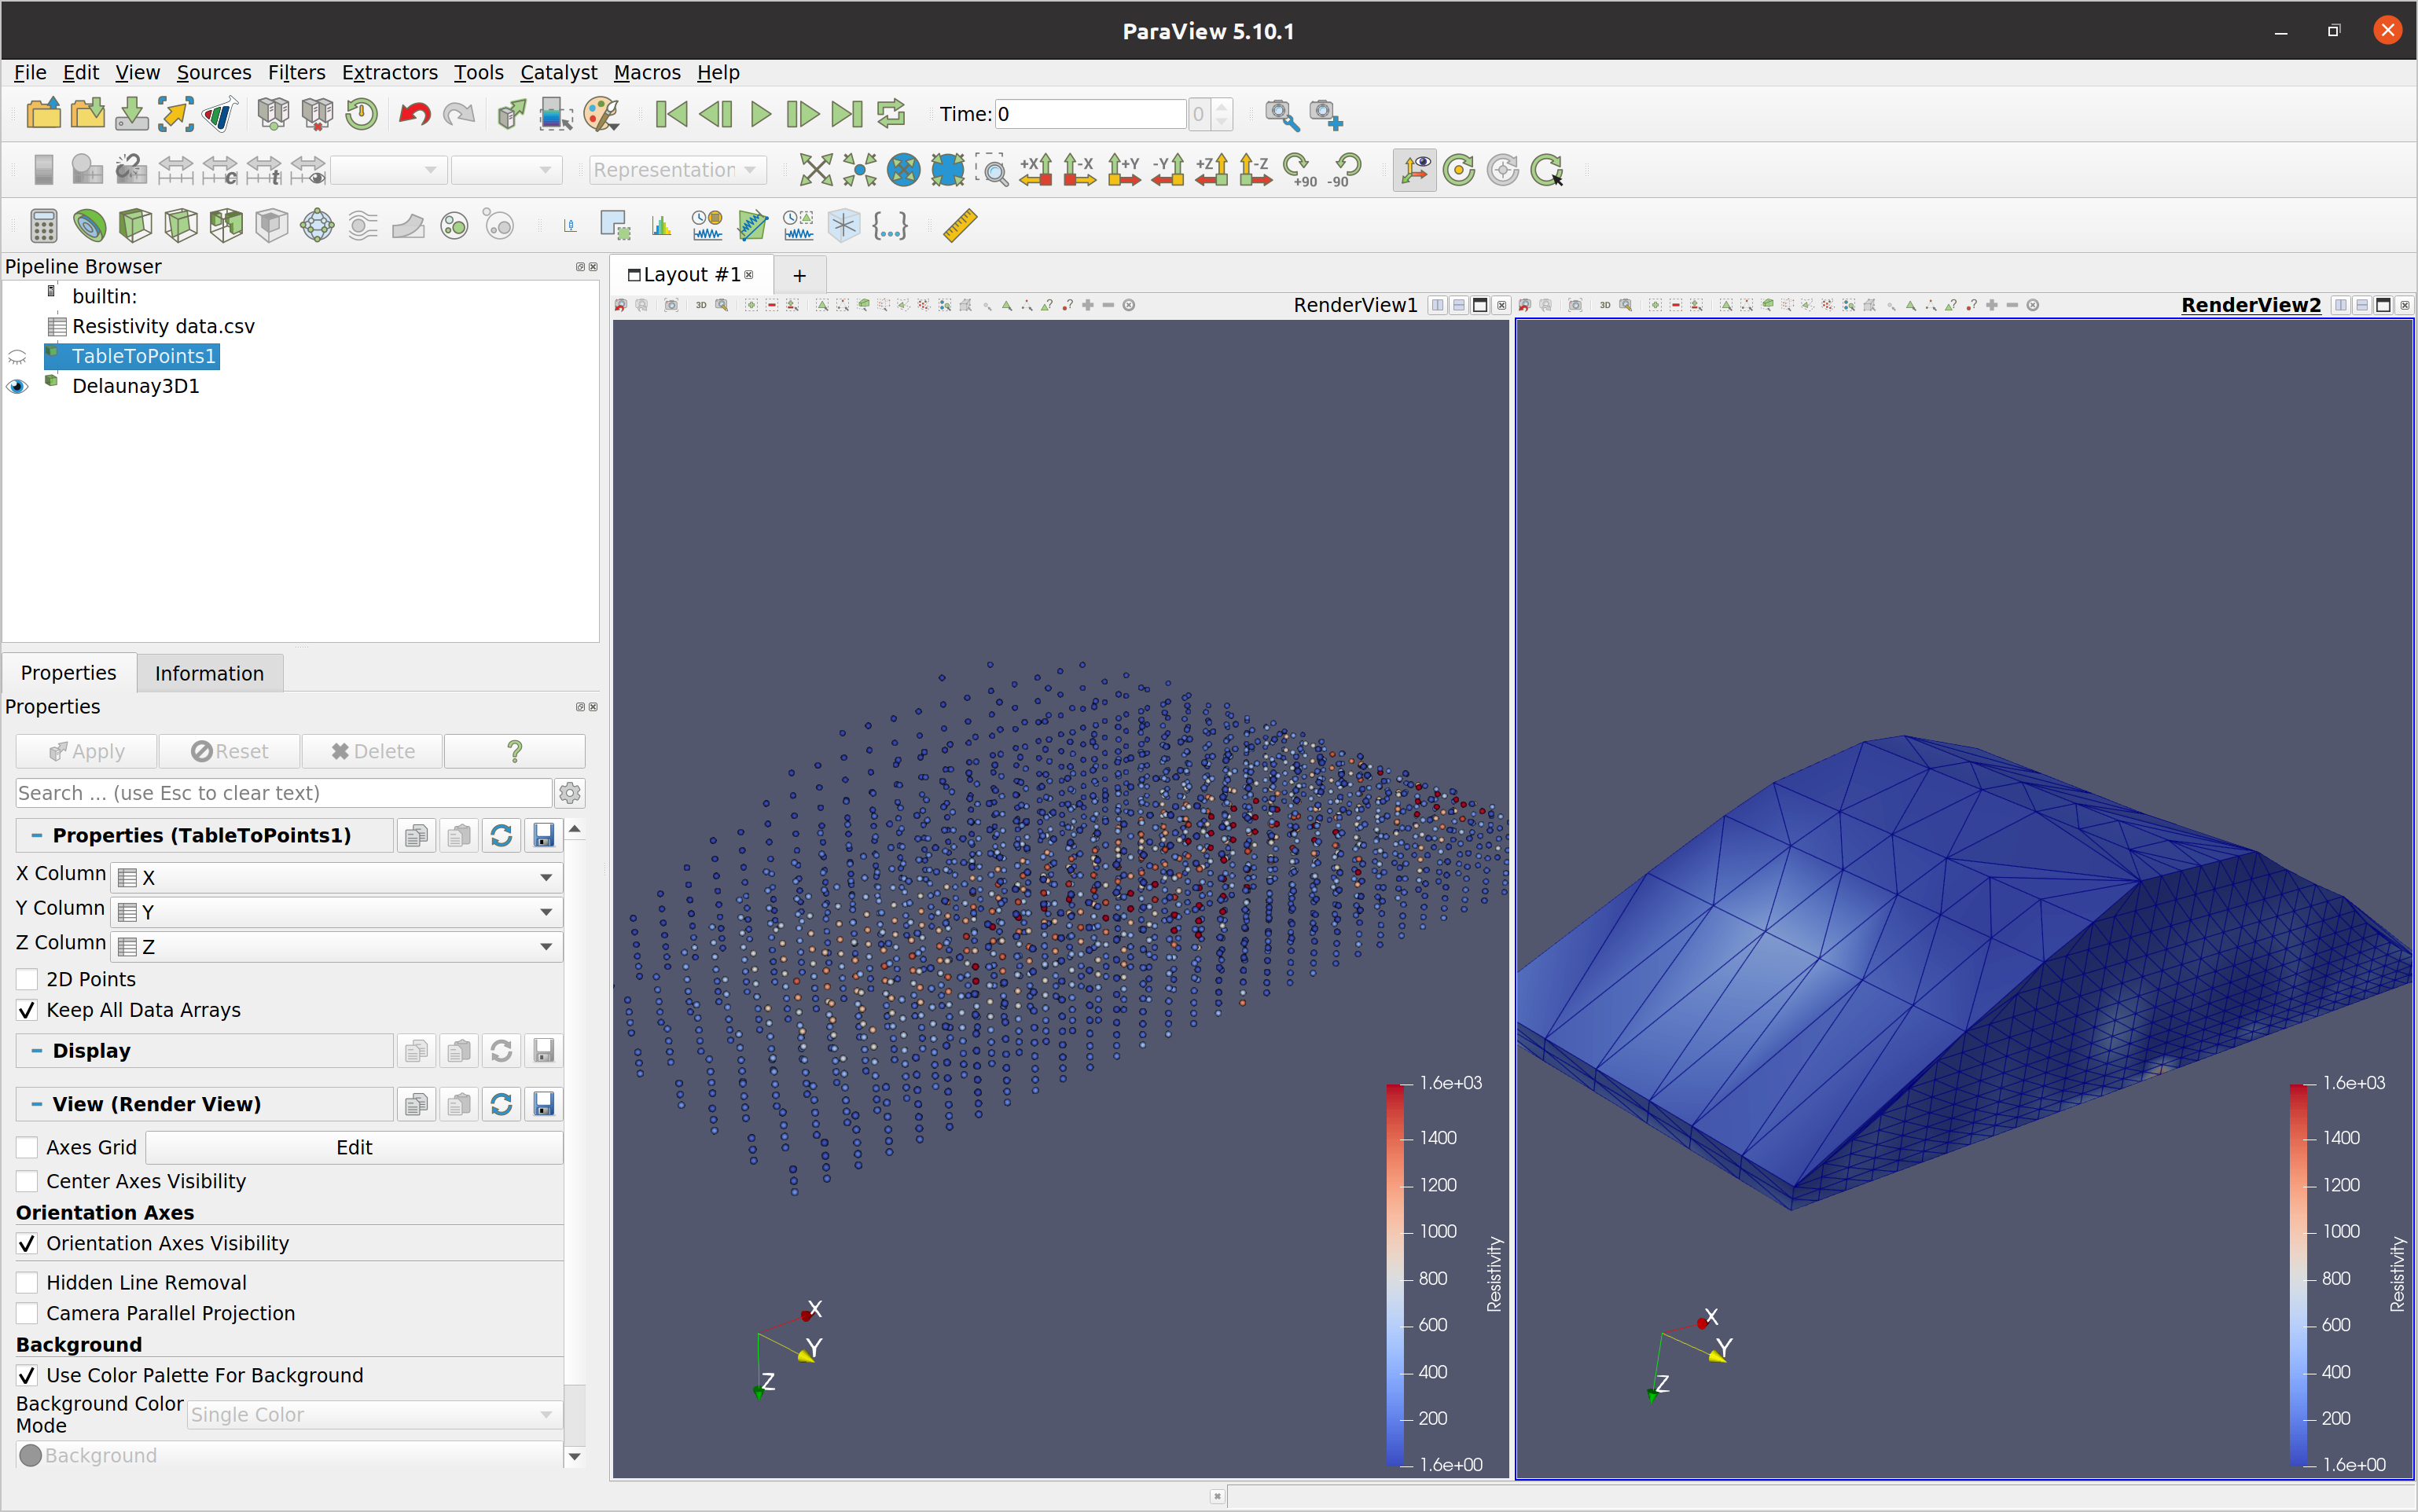
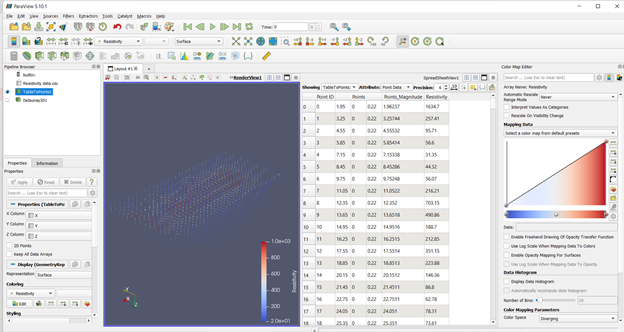
You can convert your table to to points using the Table To Points filter from the Filters menu color them by resistivity instead of the default solid color. I also suggest using Point Gaussian as representation to make the points more visible (see left below). If it makes sense for your dataset you can also try the Delaunay3D filter and produce a (convex) 3D representation or your data (see right below).
Christos,
Thank you for your response. Regarding the data format, do I need to keep x, and y negative and z positive? Which is the better way to keep the data.
Thank you.
Seun
There is no need to constrain your values you can keep them as they are.
Thank you so much Christos
Hi All,
I generated 7 2D lines as points as shown in the attached. Is it possible to make those points thick lines? I know I can display the data as Delaunay3D but I still want to keep all the 7 separately.
Thank you