Hi,
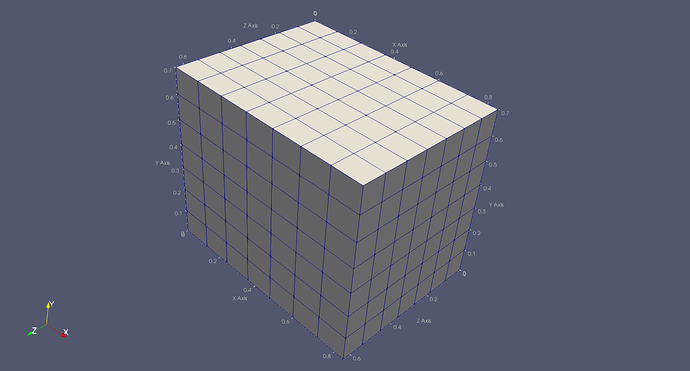
I have a simulation which runs on a simple, rectilinear grid (with 8 points in each Cartesian direction). When running in serial, Catalyst outputs the correct information, which can then be visualized in ParaView out of the box:
serial.pvsm (166.1 KB) is the correspondent ParaView state file, whose data is serial.zip (13.2 KB).
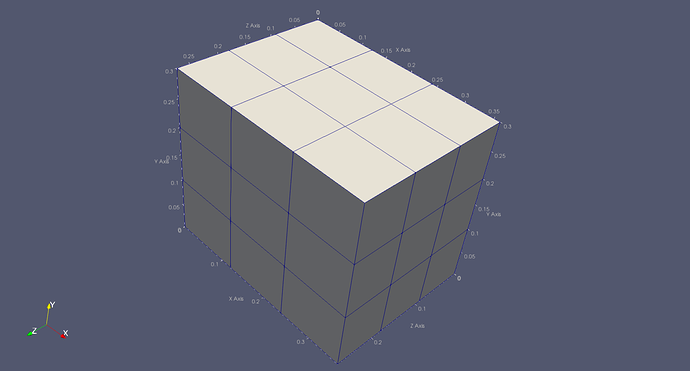
However, when running in parallel (with 2 ranks per Cartesian direction, 8 in total), Catalyst seems to output the correct grid data, but when attempting to open the pvtr file series in ParaView (at the moment I am only doing post-mortem analysis), only the part of the grid pertaining to rank 0 is shown:
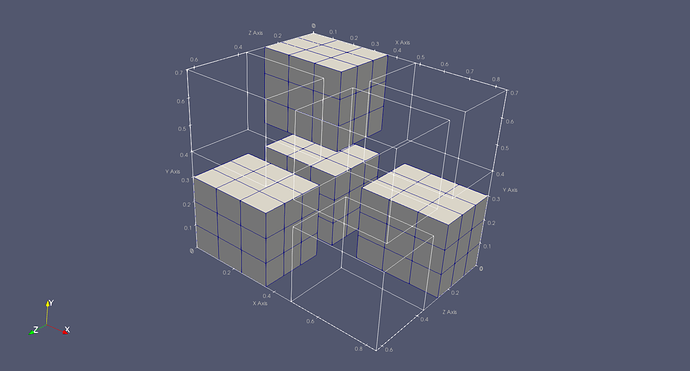
parallel.pvsm (146.8 KB) is the correspondent ParaView state file, whose data is parallel.zip (61.0 KB). If I take an arbitrary time-step folder and open separately the vtr files, I can see the remaining parts of the grid are there:
In my simulation, all fields are point-based, so having an ‘empty’ cell layer between each subdomain should not be a problem.
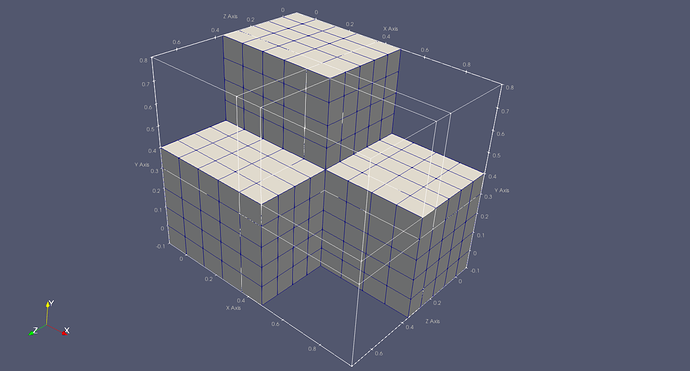
Finally, trying to send to Catalyst also the coordinates of the halo points did not help: only the subdomain pertaining to rank 0 is shown (when opening the pvtr series), but the remaining ones are actually defined in the respective vtr files:
separated.pvsm (780.4 KB) is the state file for this separate visualization; the data is halos.zip (64.0 KB).
Does anyone spot an error on my implementation? If not, then there might be a bug within the vtkRectilinearGrid class.
Thank you very much,


