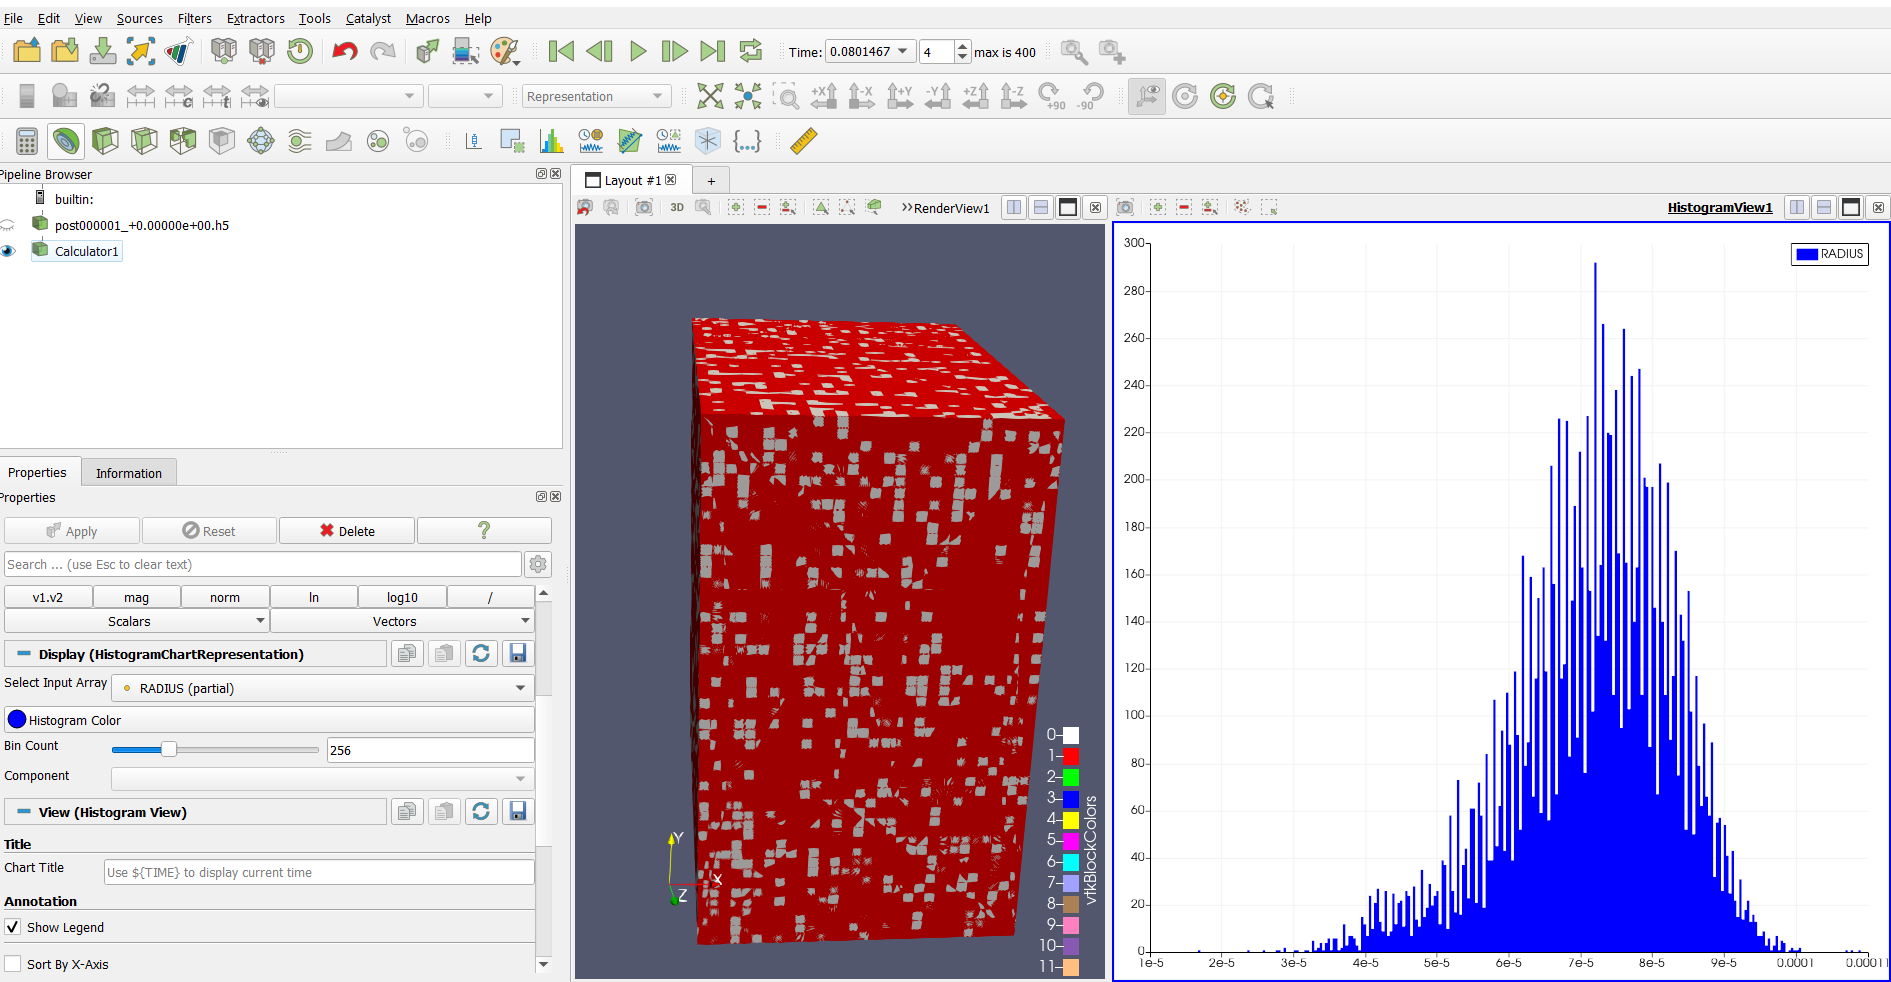
The optimal situation would be to have several graphs in the same picture to show the change in distribution at different times.
Is this possible in paraview? And if not, is it possible to extract data to excel and do it there? Had some trouble with that too…
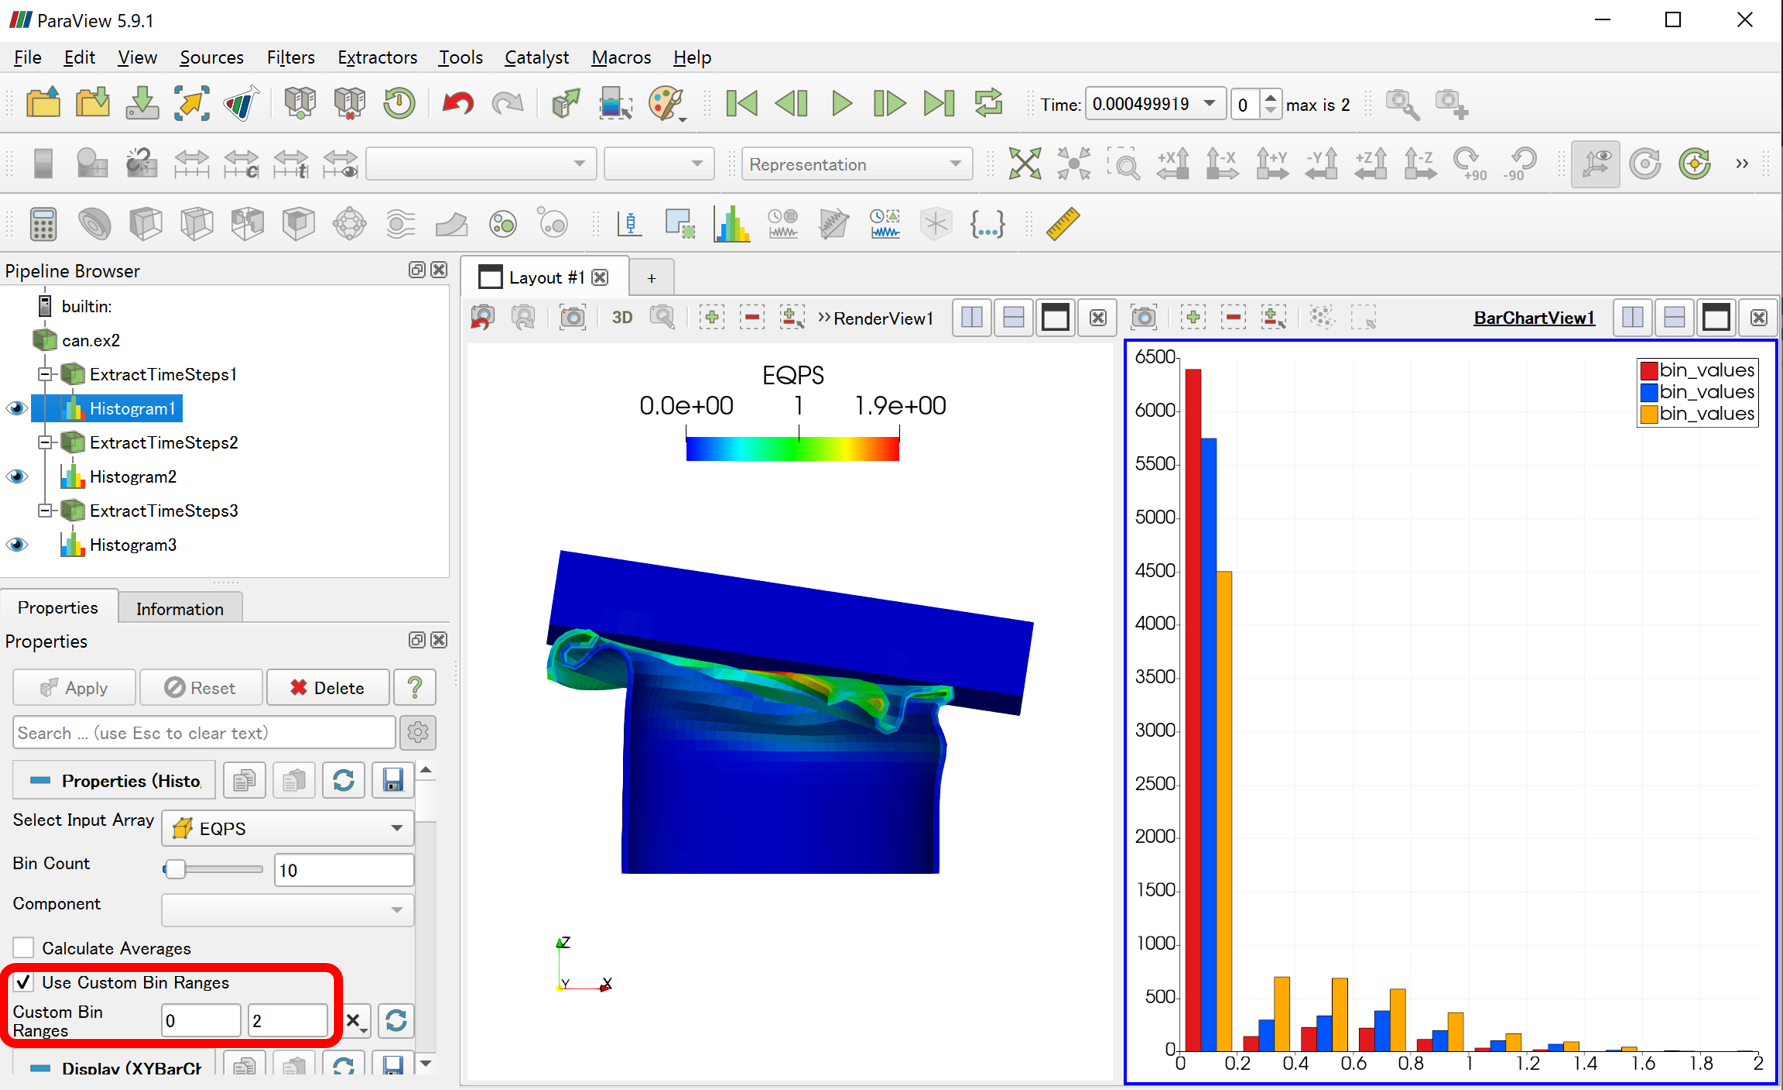
One way to do this is to use the Extract Time Steps filter and the Histogram filter:
Use the Extract Time Steps filter to pick out the time steps you want to compare.
Apply a Histogram Filter to the result of each Extract Time Steps filter. At this time, it is necessary to set a common Custom Bin Ranges for all Histogram Filters.
This seems like a possible way to solve my problem.
But I have a huge amount of timesteps. Is there a way to do it more easy than manually add one timestep at the time?
For example, there is a way to automate it with a Python script like the one attached, but I am not sure if it is the way you want. histogram.py (2.0 KB)
View > Python Shell
Click on the Run Script button and load histogram.py as above.