Prism components in ParaView
Overview
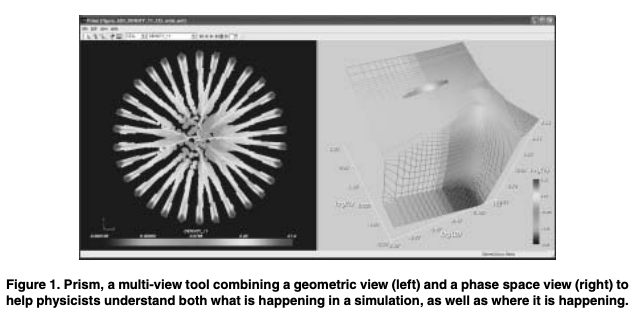
The basis of the original Prism application was two linked views that helped scientists view simulation data and equation of state (EOS)[1] data interactively in the same application[2]. This side-by-side viewing and interacting with both geometric and material state data is the general use case that a Prism capability in ParaView should support.
The main contributions of this tool that should be replicated in a general Prism capability in ParaView are:
- Linked selection between views. Selecting or highlighting data elements in either view selected/highlighted corresponding elements in the other view. With this, scientists could inspect features in either view, and understand both the phase of the material, and where that material appeared in the simulation.
- A new view that is a representation of a material’s equation of state (EOS). The view showed the position of the linked geometric data shown in the context of that EOS, which has long been a common way of viewing material properties. A generalization of this capability is a new view that manages a transformation of input data from one coordinate system into another, the results of which are graphed in the context of an input data surface. For completeness, we note that this view can be shown independent of a view of the geometry data.
A general Prism-like capability in ParaView should take advantage of the multi-view, multi-dataset, and the pipeline browser to connect inputs/outputs and provide a scientist with a flexible way to define which the data that is shown in the linked views. This proposal assumes that any VTK Dataset output can be linked to any dataset input for the 3D surface, as long as that dataset makes sense to the input. This means that with a generalized capability, the 3D view can be used as a comparative visualization element, so a scientist can study any combination of inputs. Novel contributions of a general Prism capability in ParaView include:
- Viewing and manipulating multiple high resolution data on one plot surface (see definitions)
- Viewing multiple contextual data (from different timesteps, input datasets, etc.) on one plot surface (see definitions).

We note that simplicity is critical for useability. Though the components can provide a flexible way of viewing and comparing several datasets at once, the implementation in ParaView should be as simple as possible, with defaults defined as components are hooked up in the normal paraview manner (adding filters, showing elements in views, etc.), so that as few steps as possible are necessary to hook things up with default behavior. Expert users can use the capabilities for more advanced viewing if that is needed.
New Element Required for Prism Capability
The new element required by the Prism capability is a view of a linked 2D/3D plot, which takes inputs from filters in the pipeline, and whose output is linked to the input data so that selection/highlighting works across views. In our experience, scientists need fine control over the scaling, coloring, axes (limits, etc.) in order make useful plot views. Note that they are used to being able to plot things with matplotlib and other packages, and are used to having fine-grained control of plots.
The plot view is a specialized graph that shall contain:
- A 2D/3D surface whose points are defined by an input.
- This input can be a file read from disk, or a 2D or 3D dataset generated algorithmically. The file can be one of many formats, and in addition to the surface defined, it may contain features that define areas of interest on the surface. One such input format is the SESAME database[3], an example of which is shown in[2].
- The third dimension of the plot can be shown by height, color, or a combination of the two.
- This surface is typically scaled so that it is a square (2D) or a cube (3D), and so that values shown in the context of the plot are within the square or cube.
- A set of axes clearly showing the values and units of the axes. The axes shall be adjustable in the following ways:
- Normal/log scaling
- Beginning/ending values (a subset of the range defined by the inputs)
- Normal/log coloring
- Zero or more features (lines, points and 2-D shapes) on the surface
- Global inset view, showing the relative position of the displayed section of the surface and the overall limits of the surface.
- This view shall be controlled with an on/off control
- Representations of one or more input datasets, linked to other views that show the data. Details of this representation are described below. The plot must contain information and methods for transforming the input data into the coordinate space of the plot.
Input Data Shown in the Context of the Plot Surface
Input data shown in the context of the plot surface must be transformed to the coordinate space of the plot. This requires controls or metadata that
- Maps input variables to dimensions of the plot
- Provides a transformation of the input data into the plot data space. For example, this can be as simple as converting units.
Input data linked to the plot shall include the following representations, to most effectively show a subset of data within the context of a larger set of data. We note that multiple inputs (high resolution and contextual data) can be mapped to a single plot surface, and the components should be designed to support this.
- High Resolution Data. This is data that is shown point-for-point in both the scientific view and the 3D surface.
- Selected/highlighted Data. This is high resolution data that is shown as selected or highlighted in all linked views so that a scientist can compare the data in each context. The selection/highlighting can be driven either through UI interaction (selection) or by algorithmic means (filtering based on some attribute that may not be represented in the 3D mapping into the 3D surface).
- Contextual Data. Contextual data creates a summarized view of a large dataset (for example, every cell in a datasets) to be shown within the context of a plot. An example would be a ‘topographical view’ of all cells in the dataset, showing a summary of where the data is. For example, a million cell dataset could be summarized into a heat map shown with just a few lines. We note that this could be shown as projected onto the surface, or as a 3D blob that shows overall variance from the surface as well.
- Showing contextual data is a critical component to making this an effective tool, as it is often useful to show a small subset of data within this larger context. Effective methods of summarizing esp. large data (billions of cells/points) and showing them in the context of the plot are critical.
We note the following about plot views:
- The points viewed in the context of the plot surface need not be constrained to the surface, so the visualization should take this into account. For example, providing a wireframe representation of the surface, instead of simply a surface representation will allow a user to see points that are below the surface.
- Different glyphs should be available for points of interest, per typical paraview UI (sphere, point, cone, etc). The effectiveness of these glyphs varies with the number of high resolution points shown, and different approaches and glyphs should be easily adjustable by the users.
Citations
- “The EOS is a thermodynamic equation that relates state variables”. Equation of state - Wikipedia
- D. H. Rogers and C. J. Garasi, “Prism: a multi-view visualization tool for multi-physics simulation,” Coordinated and Multiple Views in Exploratory Visualization (CMV’05), 2005, pp. 85-95, doi: 10.1109/CMV.2005.15. Here.
- K. S. E. Holian. T-4 Handbook of Material Properties Database, LA-10160-MS. Los Alamos National Laboratory, Los Alamos, NM, November 1984.