Hello Experts,
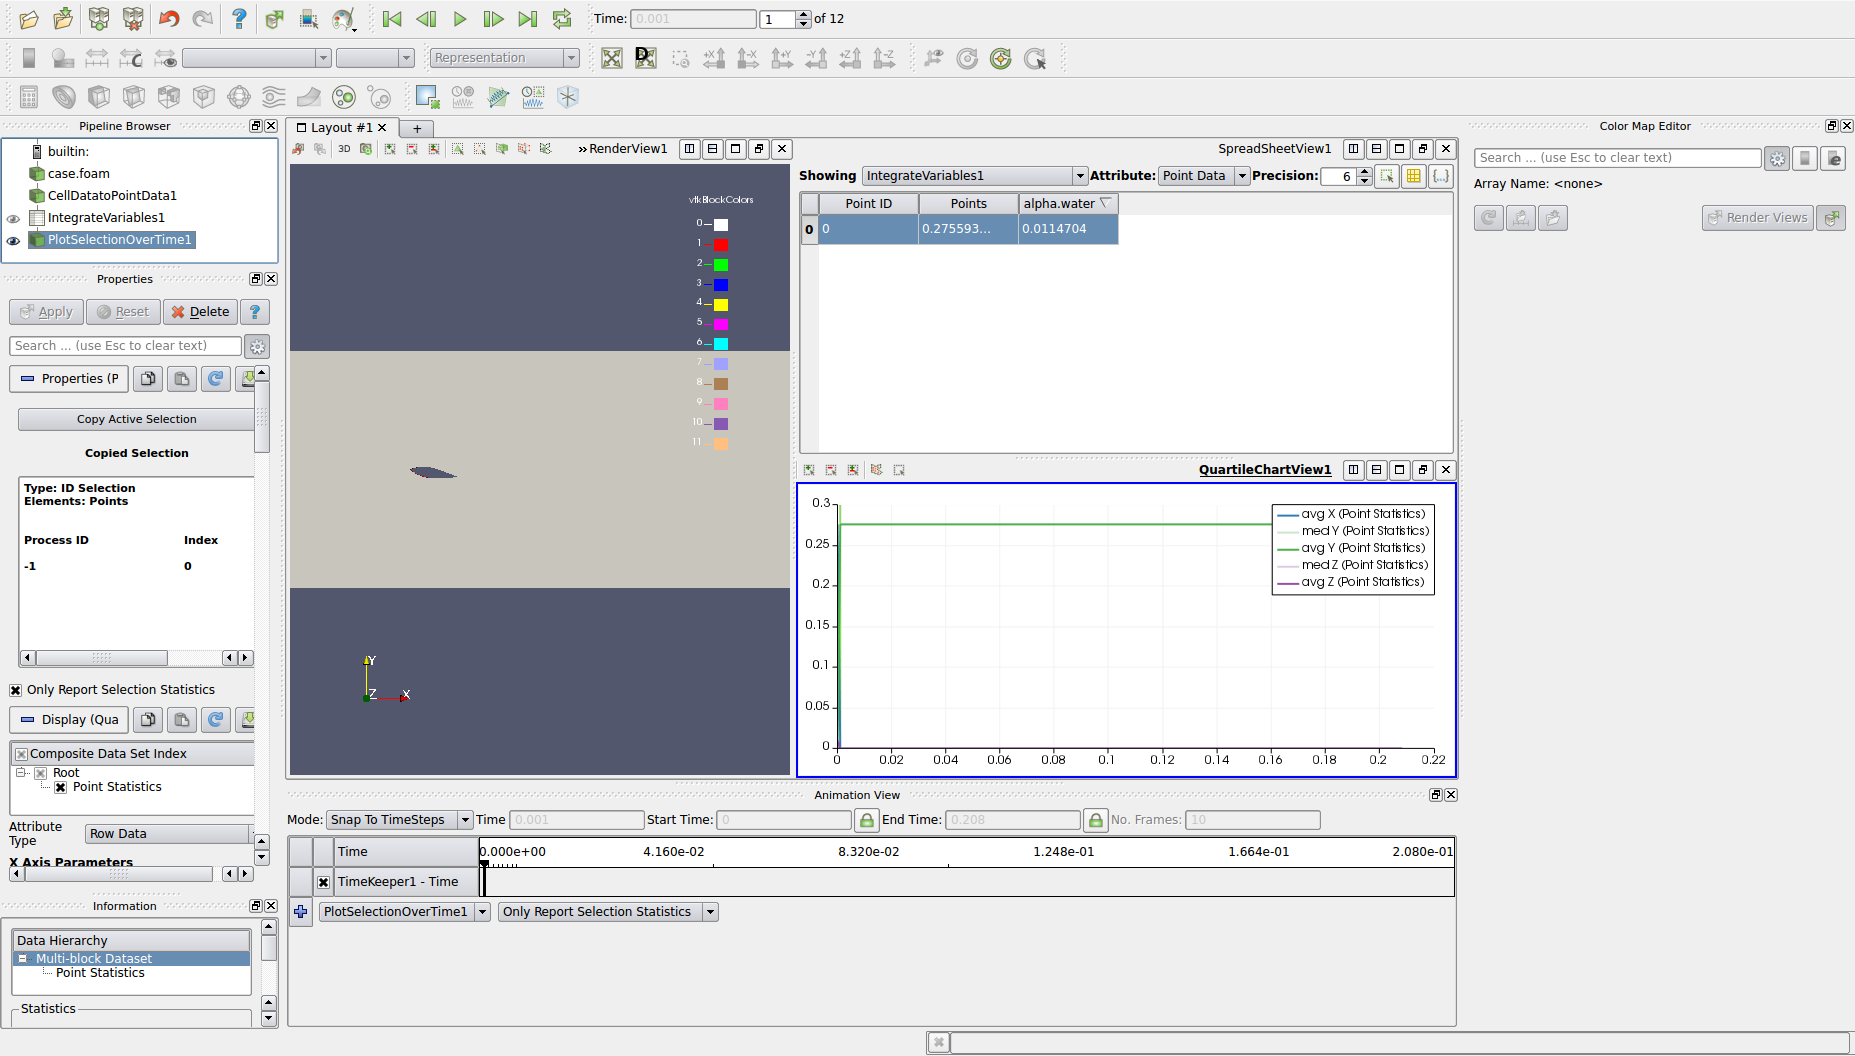
I have simulated a case file in OpenFoam, in this case I have a scalar called “alpha.water”. I want a plot of the integral of “alpha.water” against time. For achieving this, I selected the case file (suppose 12 time steps are there) --------->CellDatatoPointData------------->integrateVariables------------>PlotSelectionOverTime
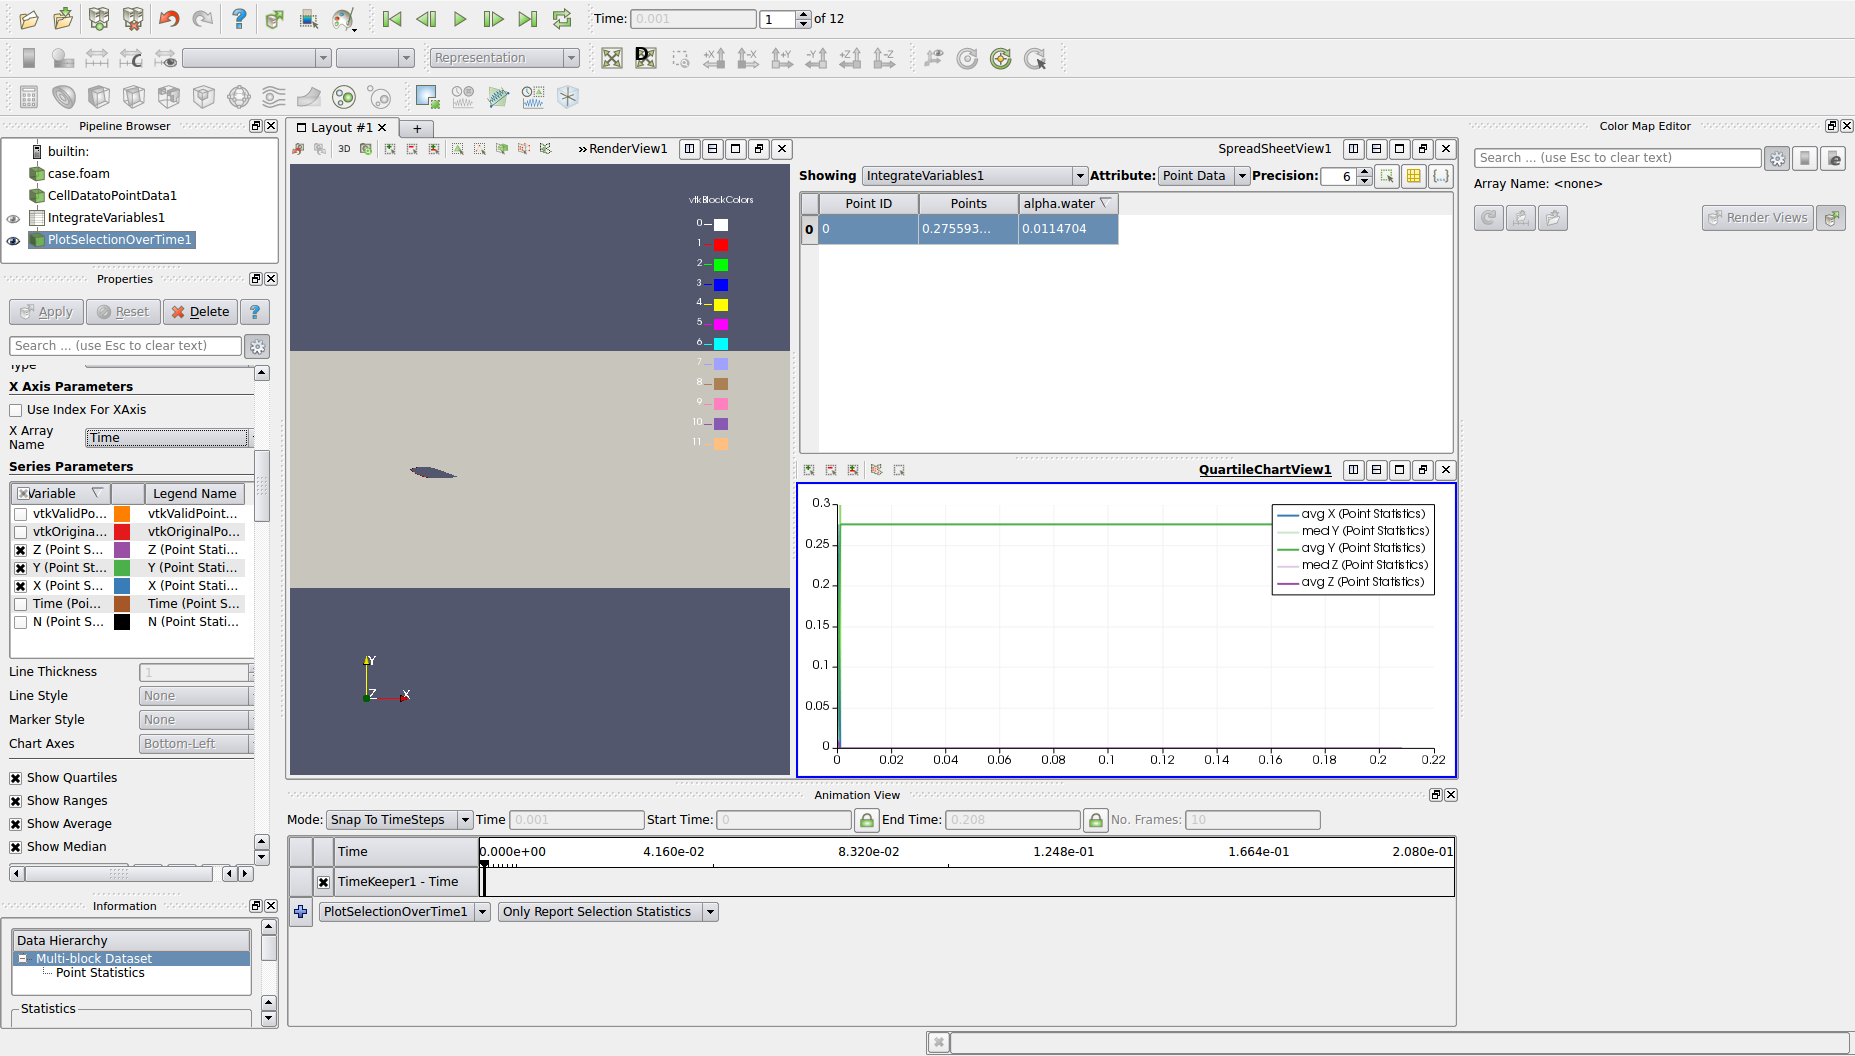
I think till integrateVariables the output data make sense, since it gives the averaged value inside the domain at each time step. But when I am trying to plot this with respect to time using PlotSelectionOverTime, it is outputting weird values like avgX, avgY, avgZ, medY etc. I am not sure what I am missing in the “PlotSelectionOverTime” filter. I have attached the screenshot for more details, any comment/suggestion will be a great help. Thanks in advance.