Hello,
I am editing pvw-visualizer.py to show my own objs in paraview-web browser. However I have met some problems.
First of all, I have successfully shown models in web browser using polydata. But I can’t set the attributes like colors, or show models in vertexs, edges modes.
Secondly, I want to show lines in this way, but failed finilly:
I think you have too many questions and it is hard to follow. It might be easier to number them.
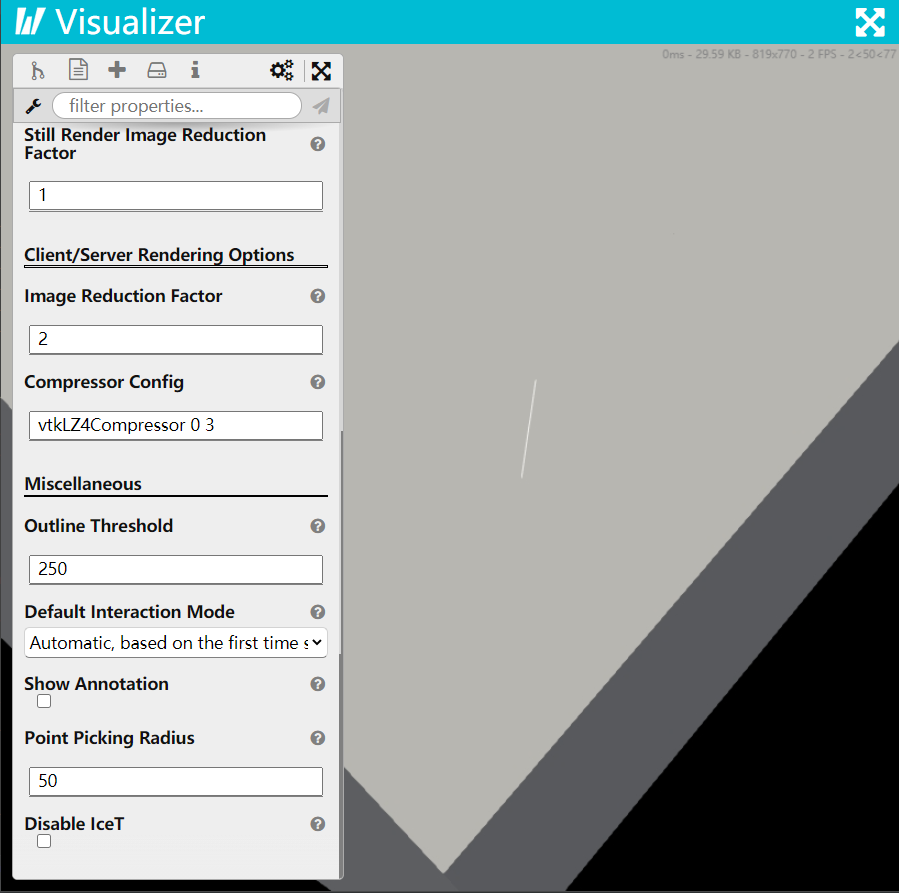
It seems that you can show your geometry vertex by selecting “Points” rather than “Surface”. The same is probably true with color when using the drop down just below.
Visualizer is based on ParaView, you need to use the abstraction layer called proxy to properly work with the rest of the framework. Basically in your vtk.vtkLineSource() code should be replaced by:
Hi Sebastien,
Thank you for your helpful reply. I am really grateful to you.
With your help, I have known how to draw lines. It seems that using proxy to programming is what I really need. Is there any references about proxy? Such as how to set colors, or draw vertexes, etc.
Thank you Sebastien! I have to work on the web part. Luckily, we now decide to use the vtk server as the web’s render server which is faster than paraview server. However when we render about 48953 vtkpolydata objects, the vtk render sever can show up the first frame in the web page on browser, but can’t zoom or rotate with the simple mouse instructions. It seems that a luge number of vtkpolydata objects will affect the performance of render server.
Could you please offer some advices for us?