Hi!
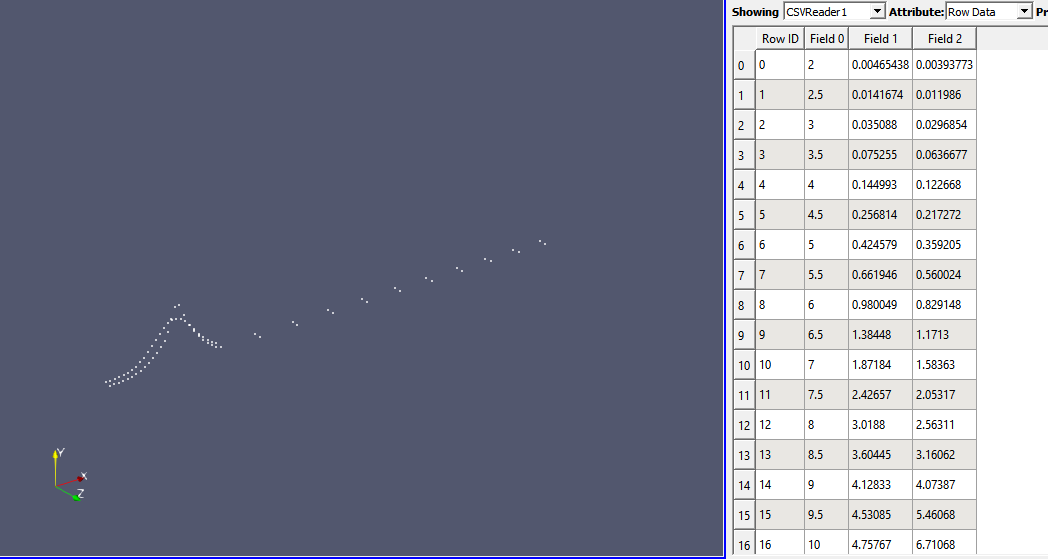
I am trying to plot data from a csv file with many columns. the X axis should be the first column, all the other columns should be on the Y axis, but with different values of Z for each column. I managed to make it manually with only 2 columns, using different filters for each column and a calculator filter to change the Z value of one of them, but I need to make it in a automatic way because I have several columns to plot. Is there a way of doing that?