Hi,
I’m trying to make a python script which do this work:
- At specific time step, find a cell that has maximum celldata of specific value(EQPS, which is ‘c1_mat_val’ in code)
- For that cell, plot over time for EQPS and three principal stresses
- Export the plot into spreadsheet form
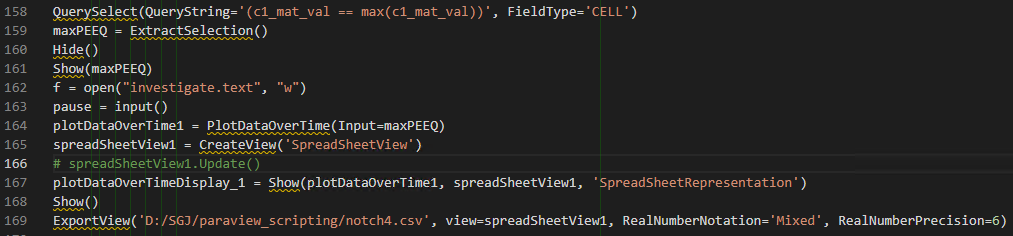
I tried ‘trace’, but the recorded script made error, so I edited the script.
But the spreadsheet that was made was wrong in two ways.
- It does not plot over specific cell. It cell differs for every time step.
- At the specific time I want, the result shows other cell compared to the result I got from GUI mode. Result from GUI mode was correct. And for each time step, the result shows not one cell. It returns statistical values(average, Q1, Q3, std, …)
So my question is, how can I get specific time step’s cell that has maximum value of EQPS and freeze, and plot over time for that specific cell?