I am using the python trace functionality to generate plots, but am having trouble with the size of the color bar. Executing the python script creates an image with the color bar much larger than on the original image saved while creating the trace. I have attached a minimal reproducible example.
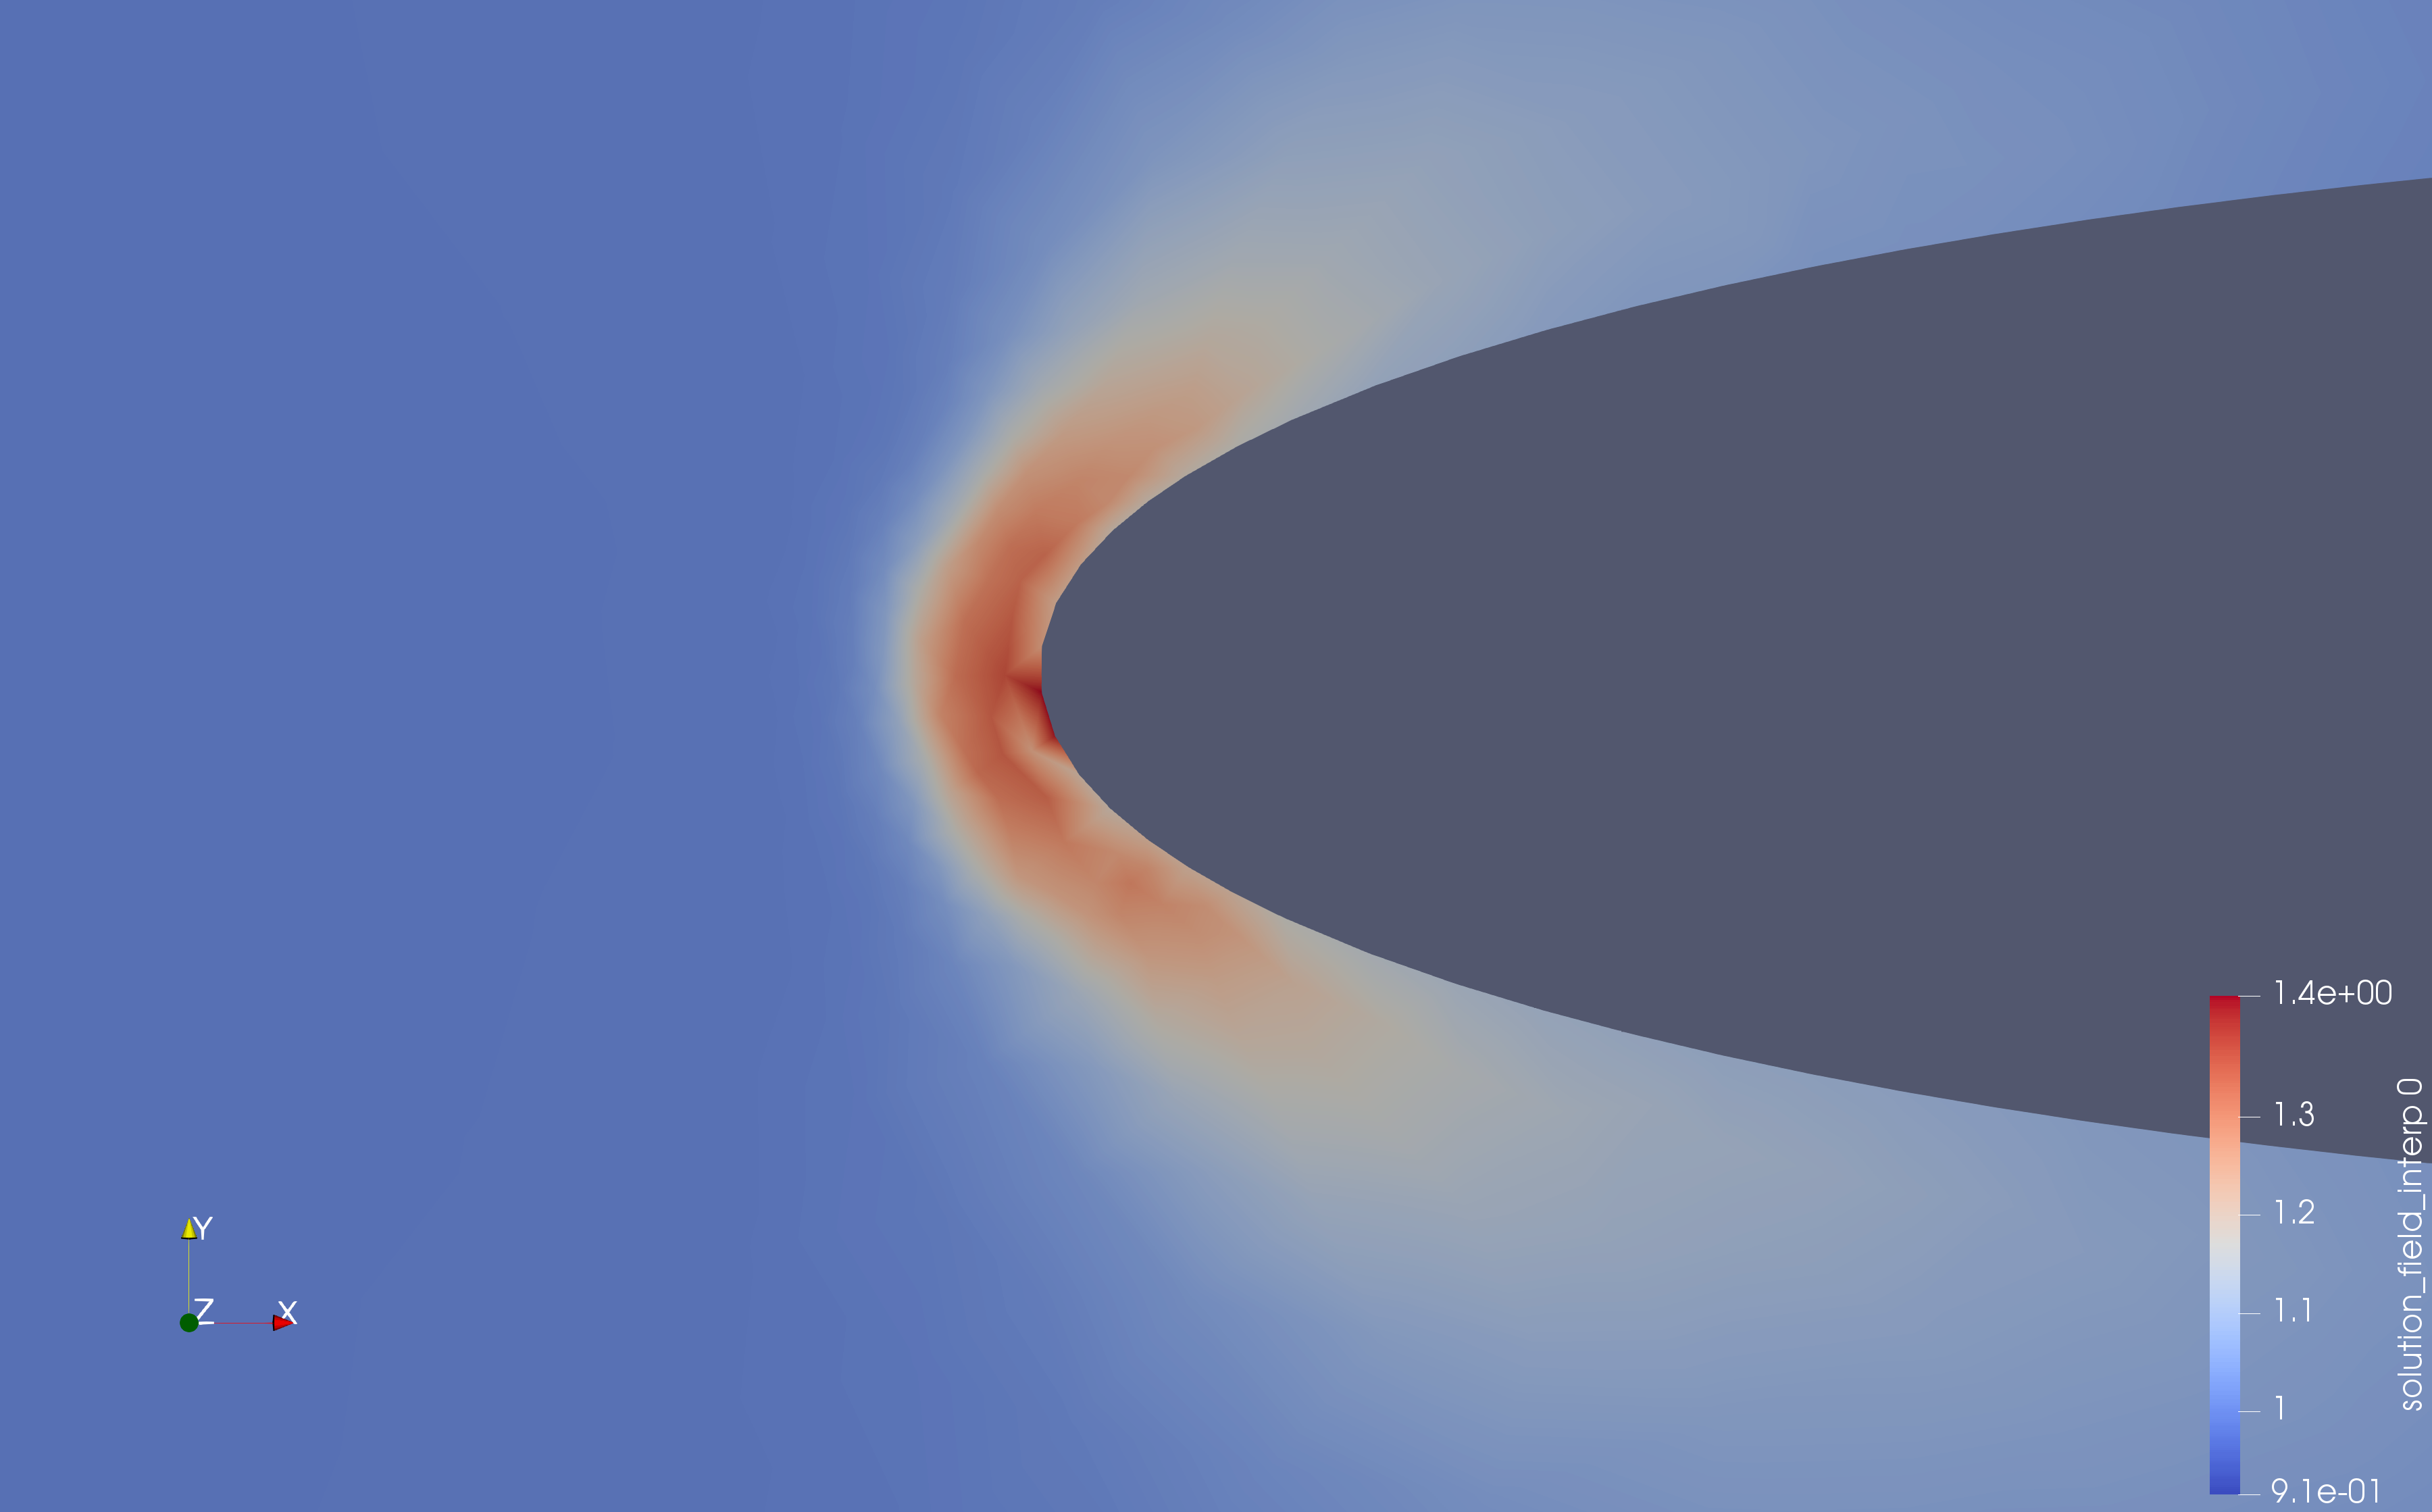
Here is the plot generated while recording the trace (density_le_orig.png):
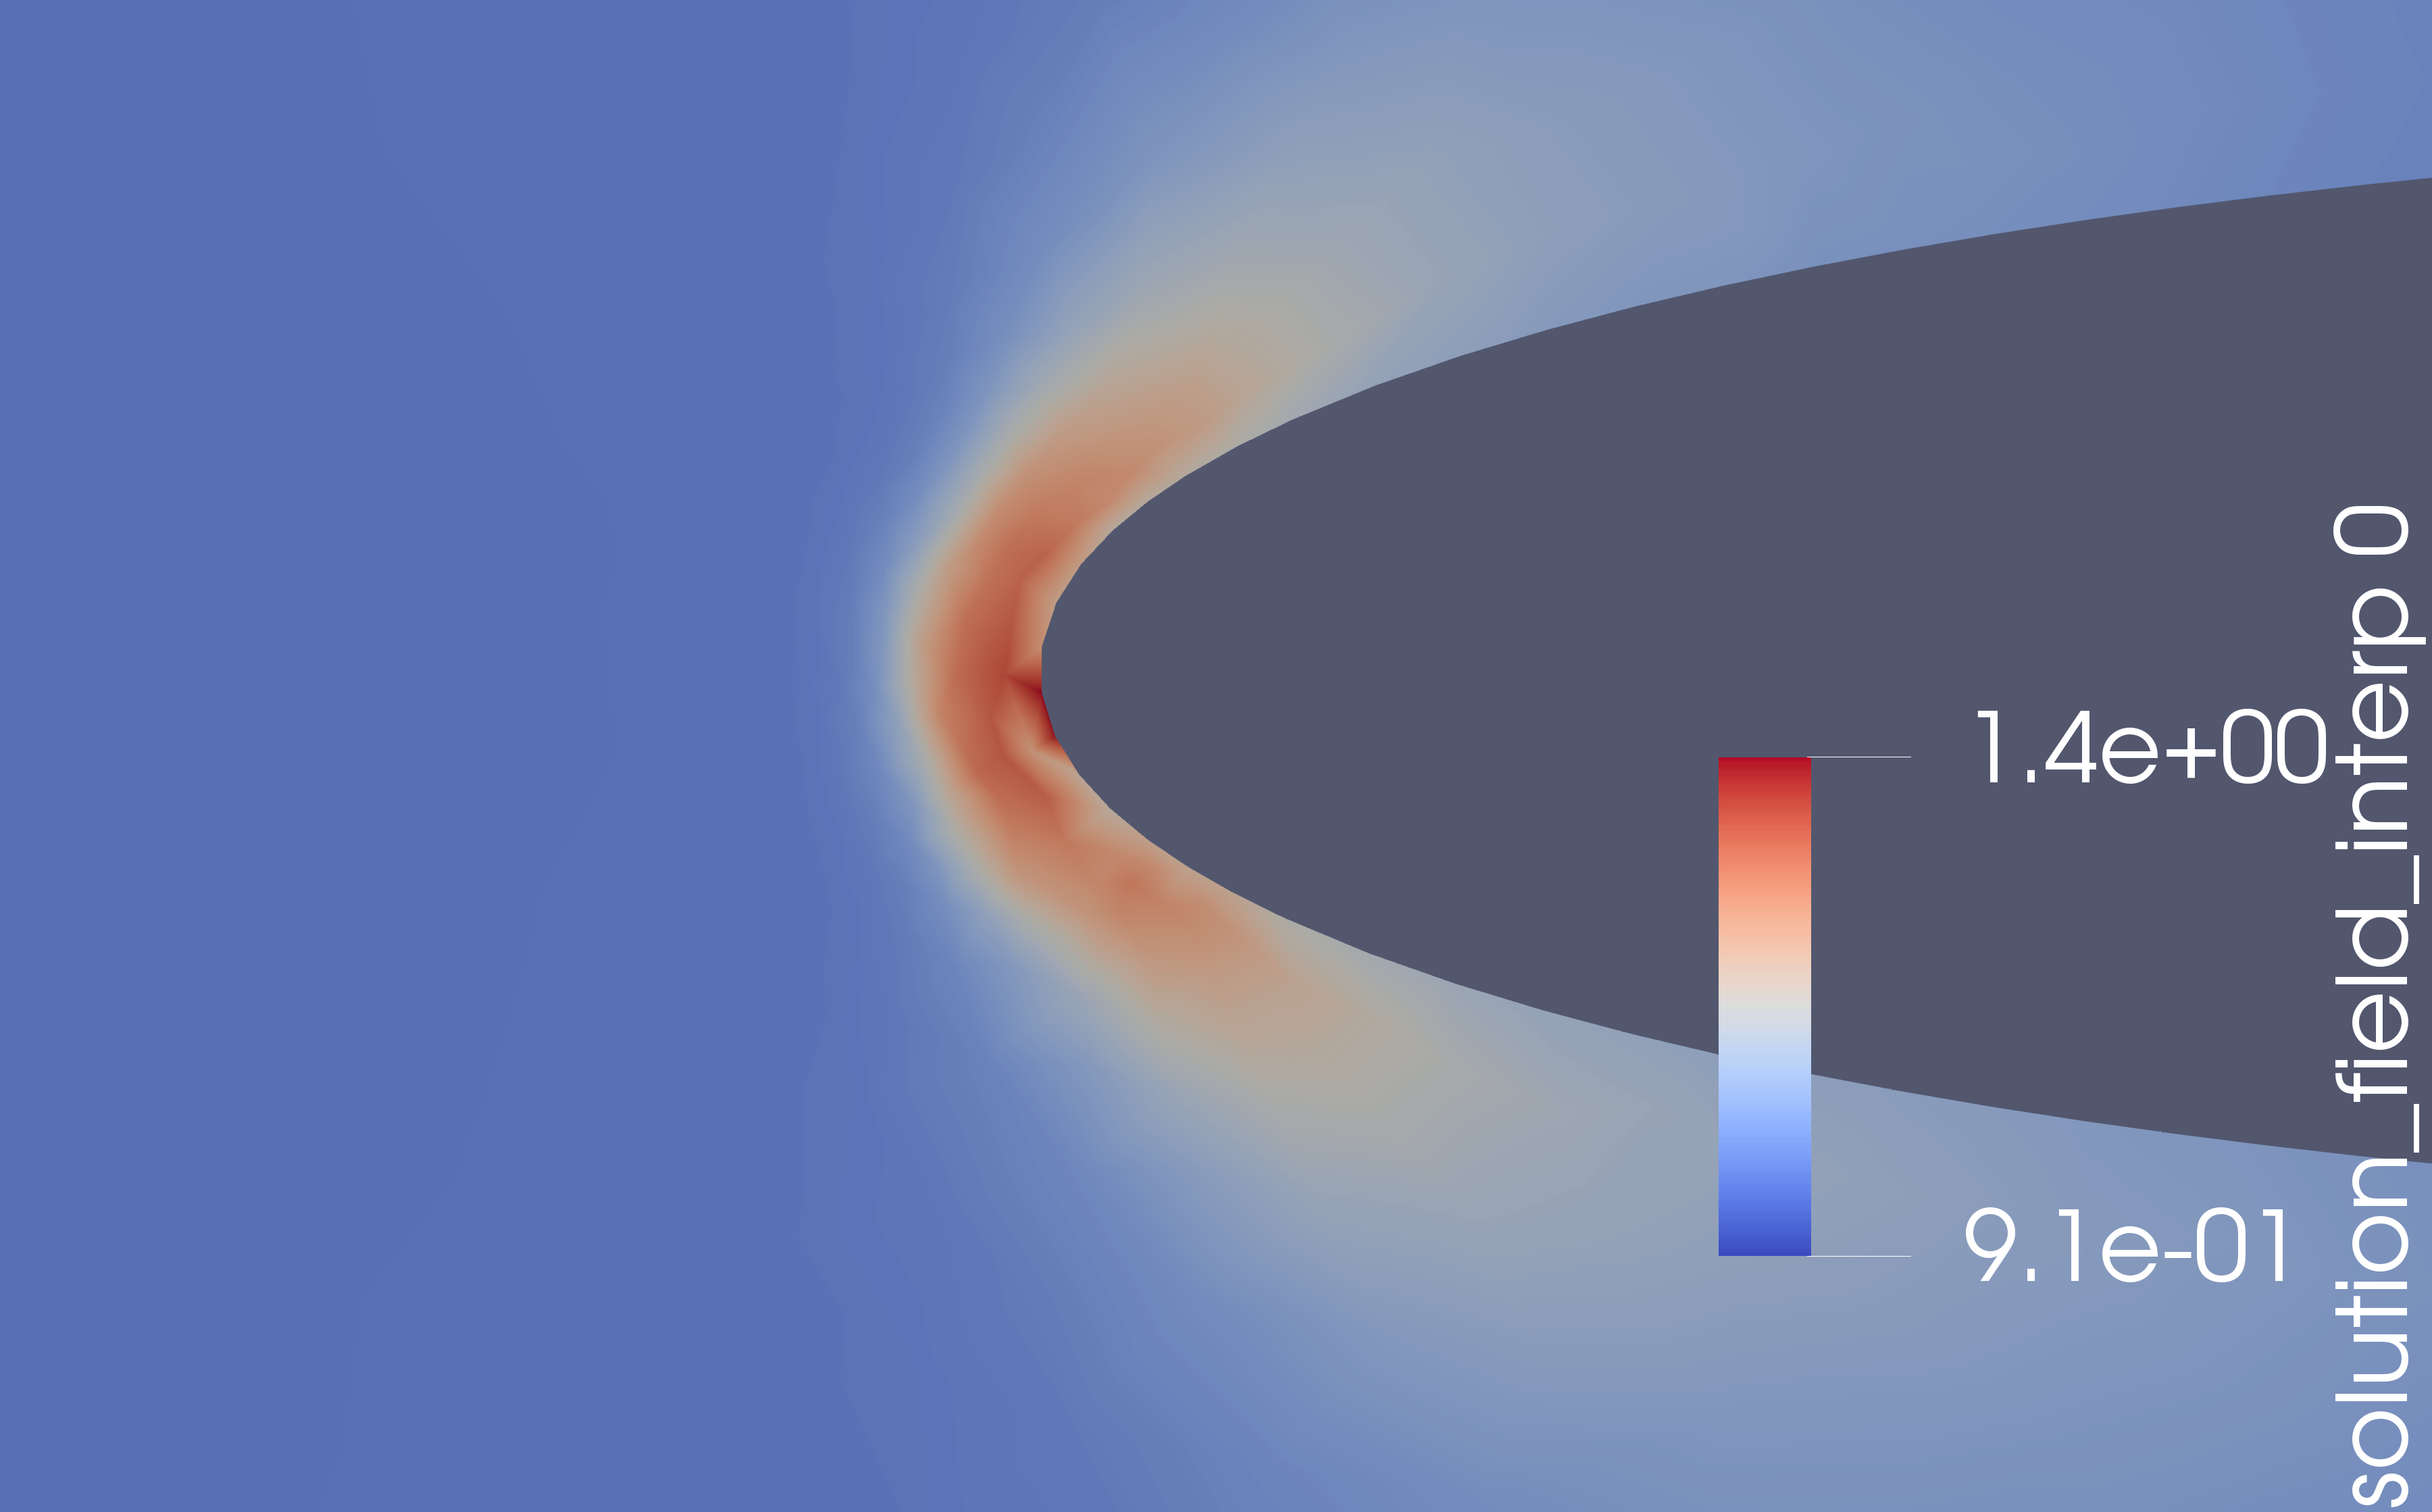
And here is the one generated by running the resulting python script (density_le.png):
The problem is somewhat similar to this , except the problem is not the color bar range, it is the size.
files.tar.gz (916.5 KB)
wascott
July 14, 2019, 9:38pm
2
This is a known issue. It should be fixed in the upcoming release. Try the 5.7.0 release candidate. Let us know if you see any issues.
Alan
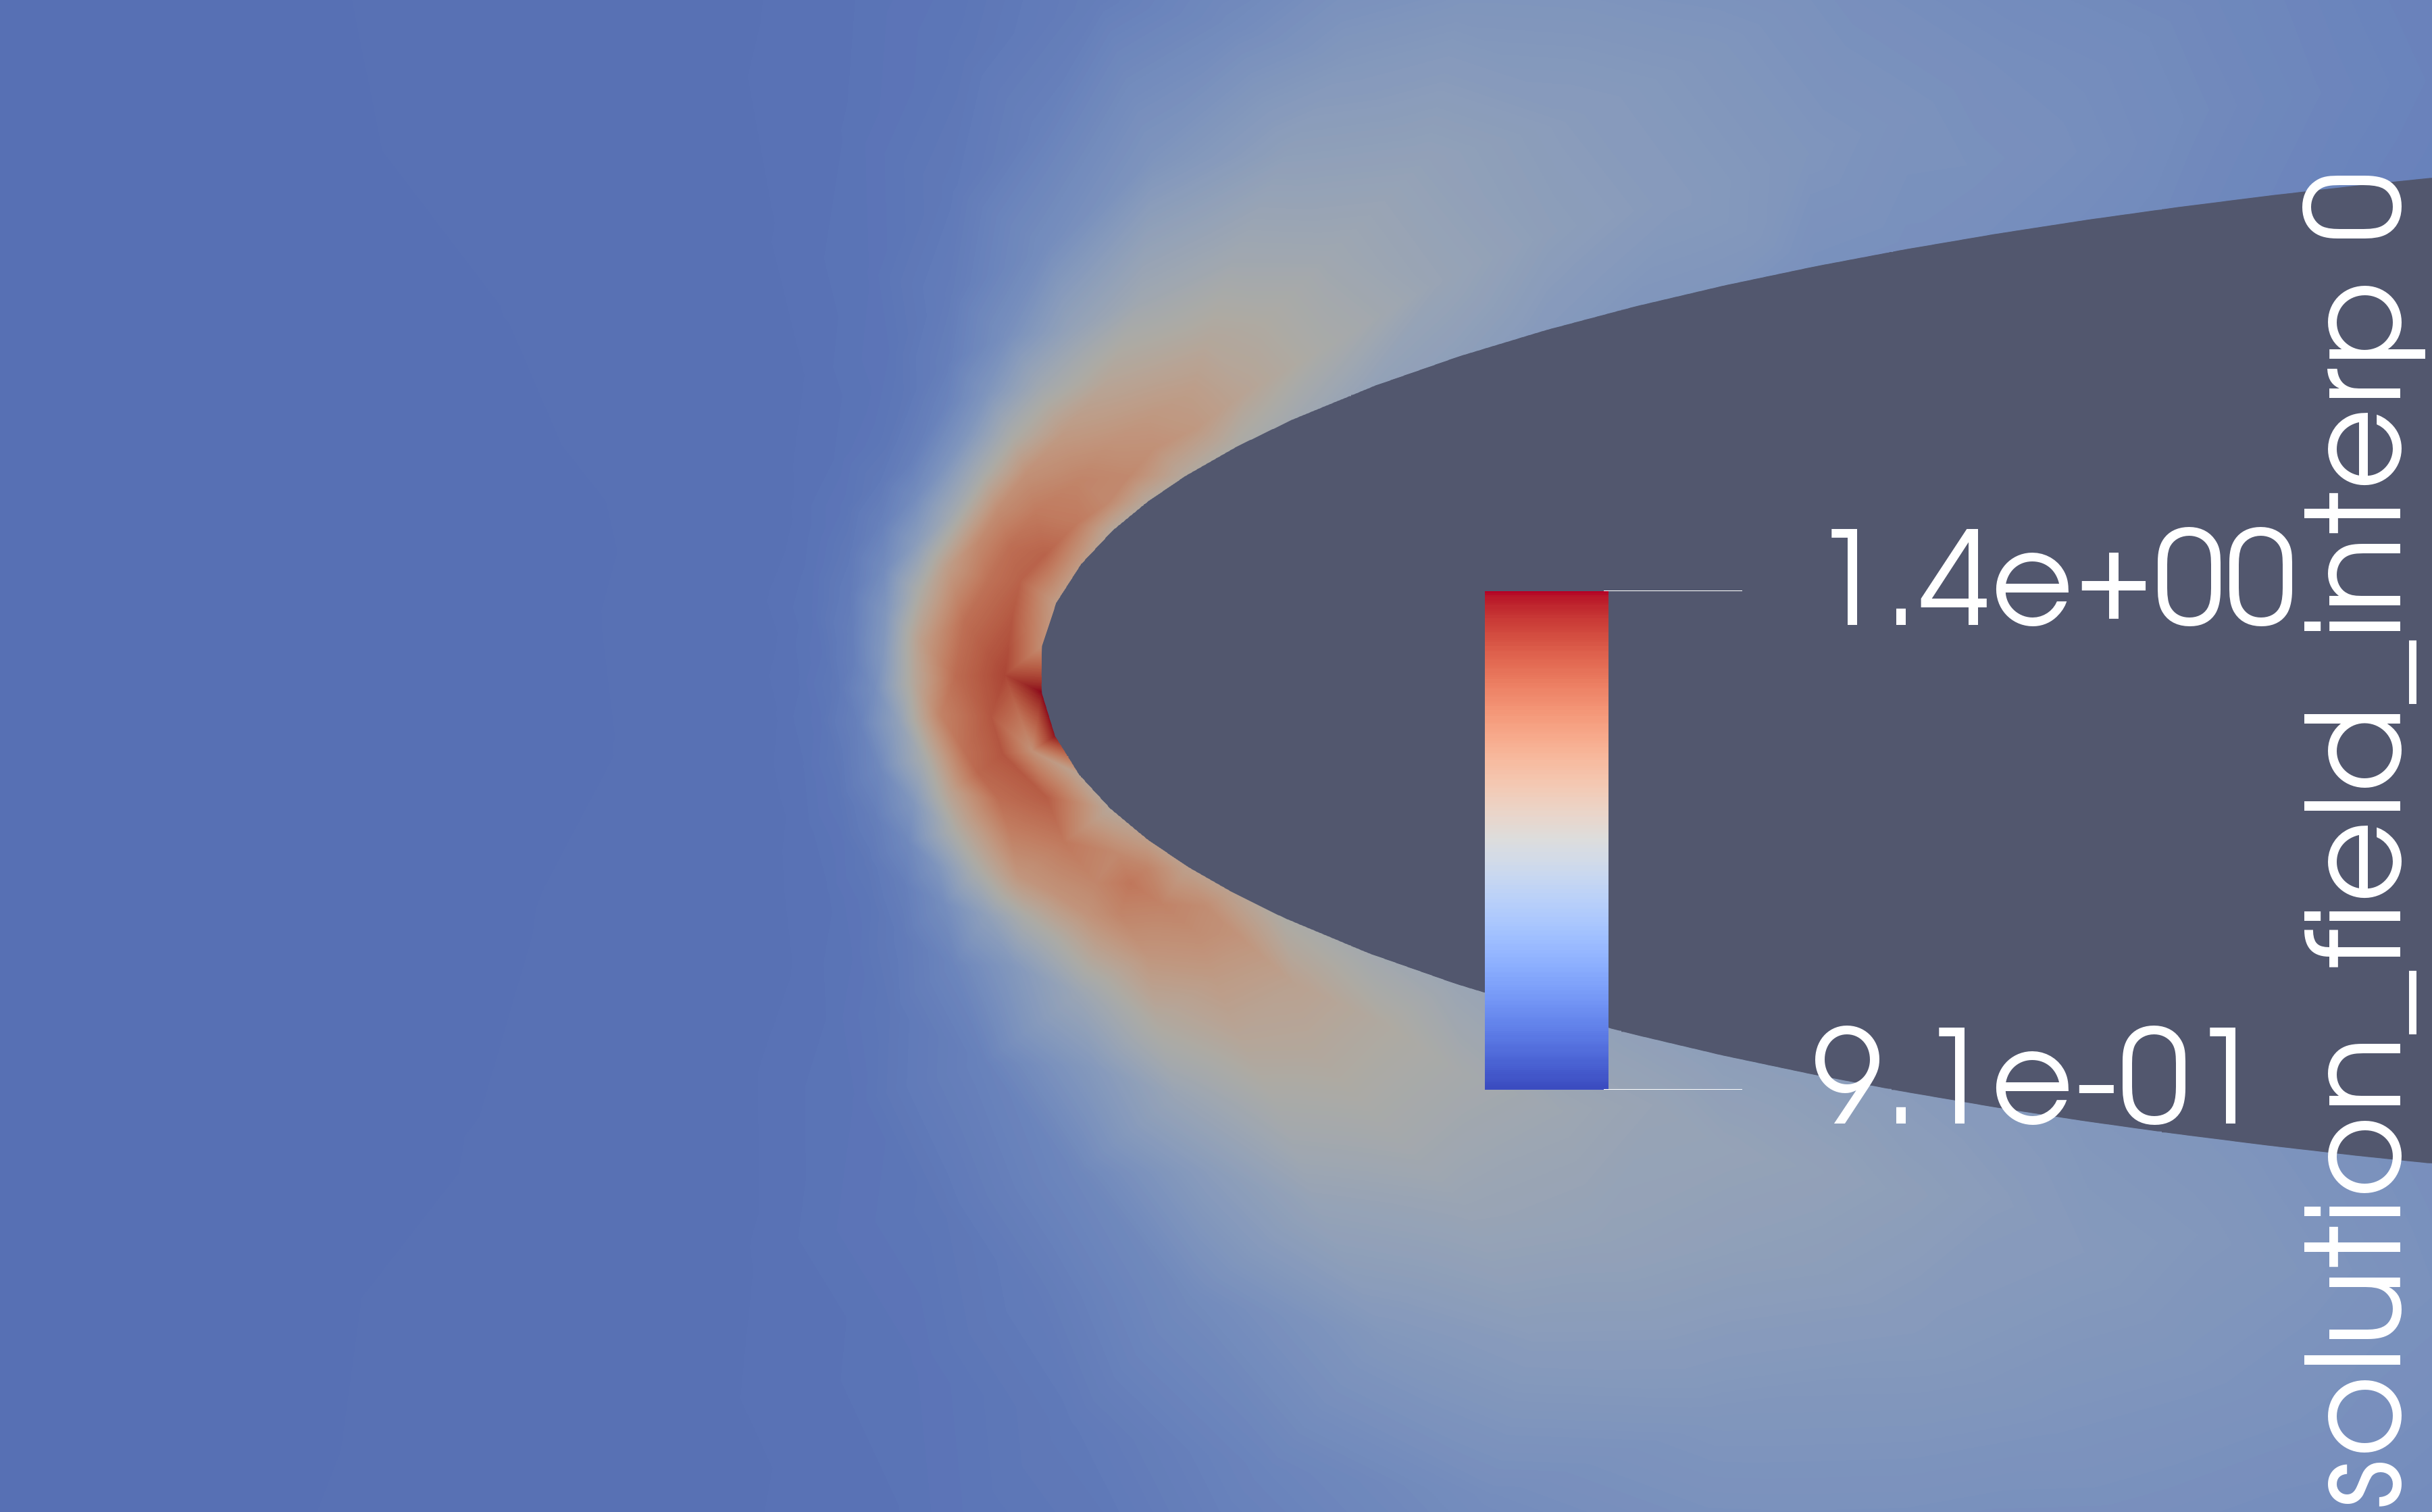
No luck with 5.7.0-RC1-MPI-Linux64bit:
cory.quammen
July 16, 2019, 4:23am
4
@wascott This likely won’t make the 5.7 release, I’m afraid.
wascott
July 16, 2019, 5:26pm
5
So, the issue is https://gitlab.kitware.com/paraview/paraview/issues/18651 ? And, you are correct. I thought I remembered @utkarsh.ayachit fixing it. Bad memory.
As stated in the bug report above, this is scheduled to be fixed in 5.8.0. This should occur early next year.
I was able to find a workaround. In the python file, I found this line:
# uncomment following to set a specific view size
# renderView1.ViewSize = [1198, 753]
It appears this sets the render view size to the same as it was when I had the Paraview window open, so the color bar is the same size.
wascott
July 23, 2019, 5:35pm
7
Good. Note that the commented out header, created with the trace recorder, reminds everyone to uncomment out this line.