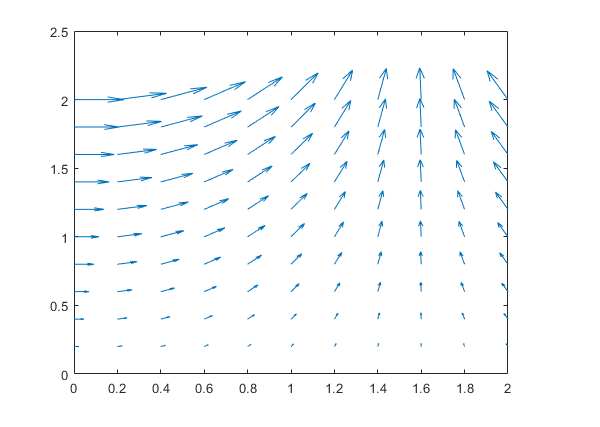
I am trying to plot a velocity vector around a sphere, similar to Quiver in Matlab.
Is there a way to do that?
I have the U and V components.
I tried to use the calculator filter and wrote : UiHat+VjHat. After that, I used the Gliph filter,
but the gliphs were incorrect.
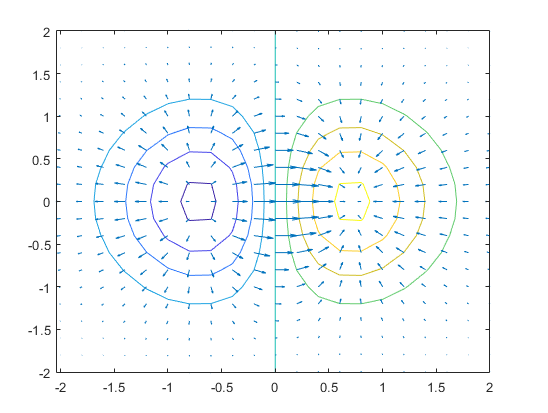
If ParaView also have contour lines - I couldn’t find a way to do that.
The problem is that if I use the calculator and write for example:
U*iHat
The gliph lines are not being drawn on the sphere using the spherical coordinate system. They are supposed to be longitude lines, similar to earth’s longitude lines.
I am trying to, but it takes forever. That’s why I tried using the Gliph arrow filter (also because that is what I actually want).
Do I need a GPU to render streamlines?
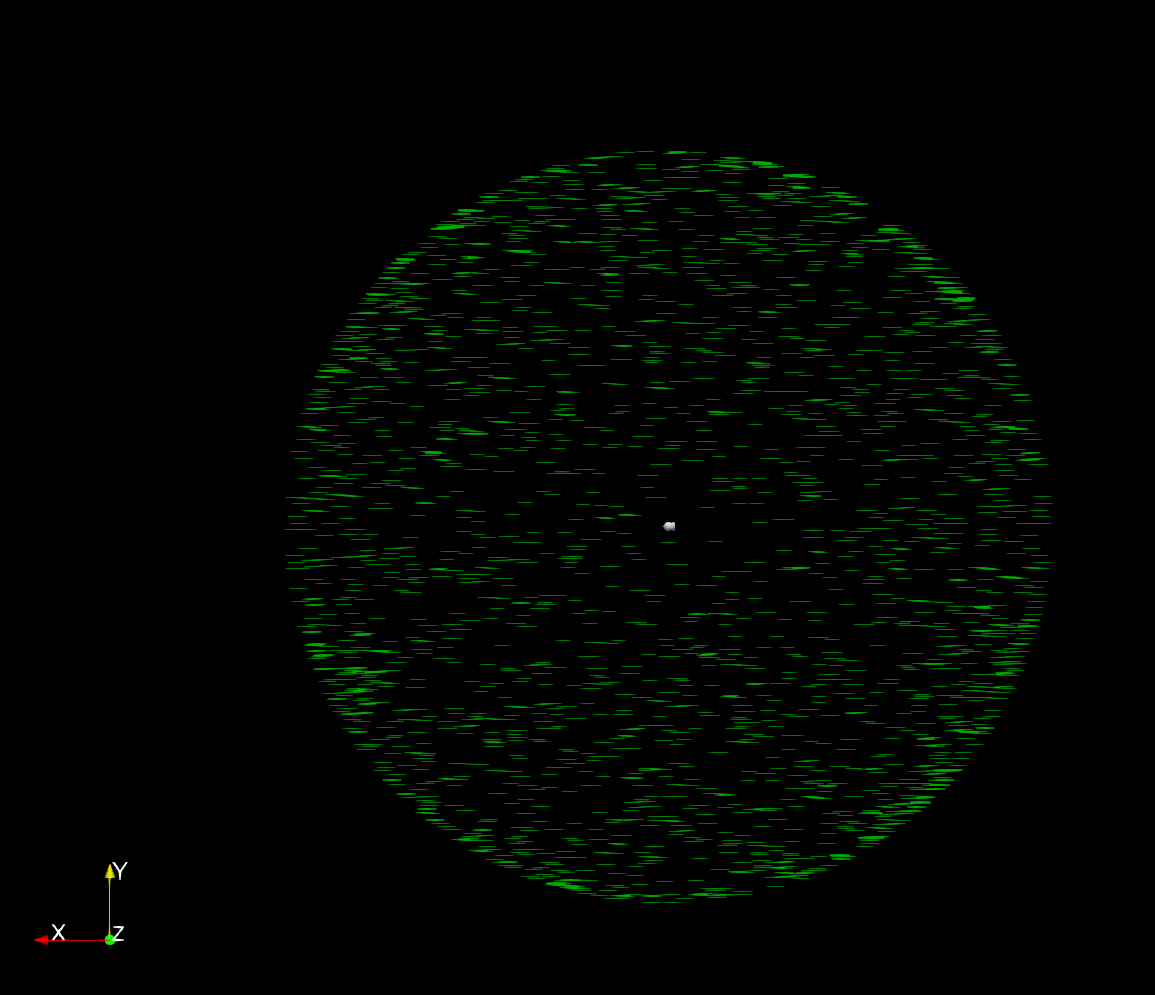
I was able to generate something, but your vector (UiHat + VjHat + W*KHat) are not at all colinear with the surface of the spere, so not really usable imo.
First of all, thank you very much Mathieu for your time and effort. I really appreciate it.
I will check the pvsm file.
I do still have a couple of questions:
Did you use a GPU and if not, how much time did it took to create the streamlines?
How can I animate such complicated streamlines if I have multiple time frames?
And third, is there a way to do the same with arrow gliphs, and if not, why?
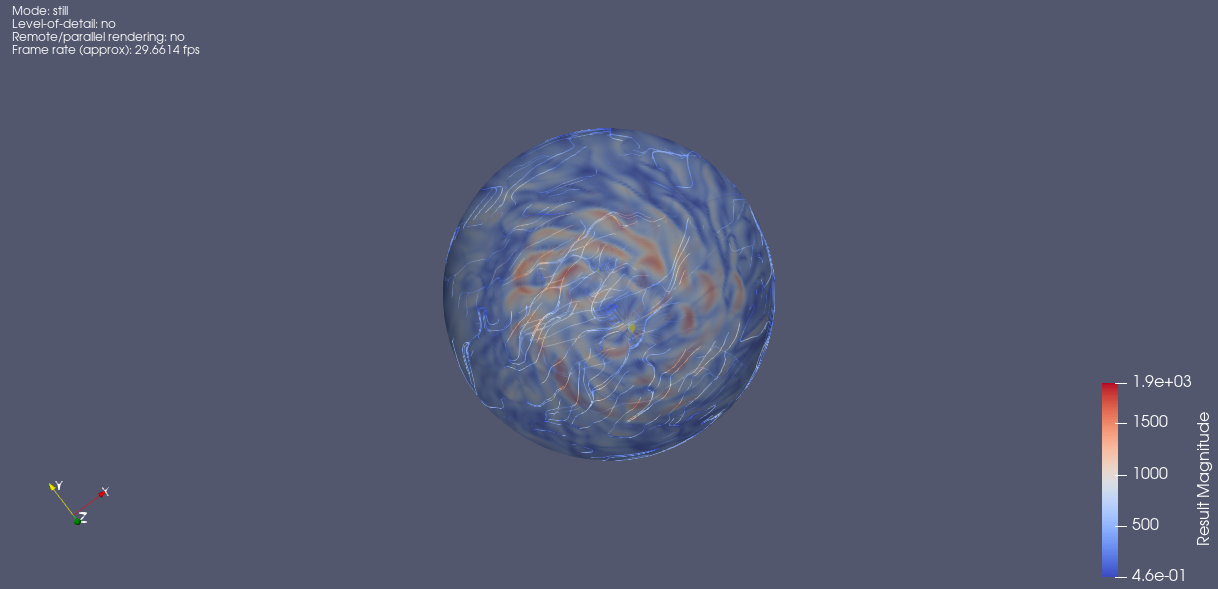
I use the GPU only to display, not to compute, nothing critical at all.
It took around 20 seconds to compute the streamlines because I generate them only on the surface.
I can’t add arrowglyphs because the vectors are not oriented correctly. The glyphs would not go in the right direction.
Can you please tell me how did you get to this conclusion? Can you please show me an example of U and V velocity components (scalars) , turned to velocity vector using the Calculator filter and using the arrow gliphs are correctly drawn around a sphere?
I checked it but I still don’t have the answer. I tried to add the attribute : “positive:up”
to the netCDF file but that didn’t change anything. Do I need to use a different netCDF reader? There is only one that is working
Is this by any chance related to the following issue:
Another thing : the colors of the U component should be the same after I write in the calculator : “U*iHat”, don’t they? but they seem like the inverse colors.