Hello everyone
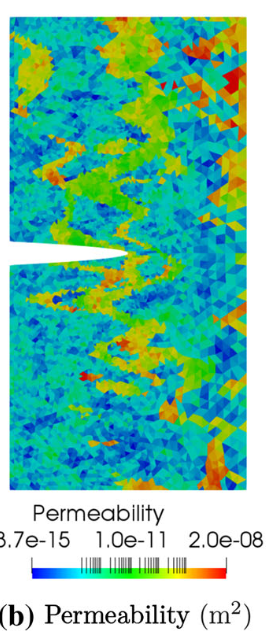
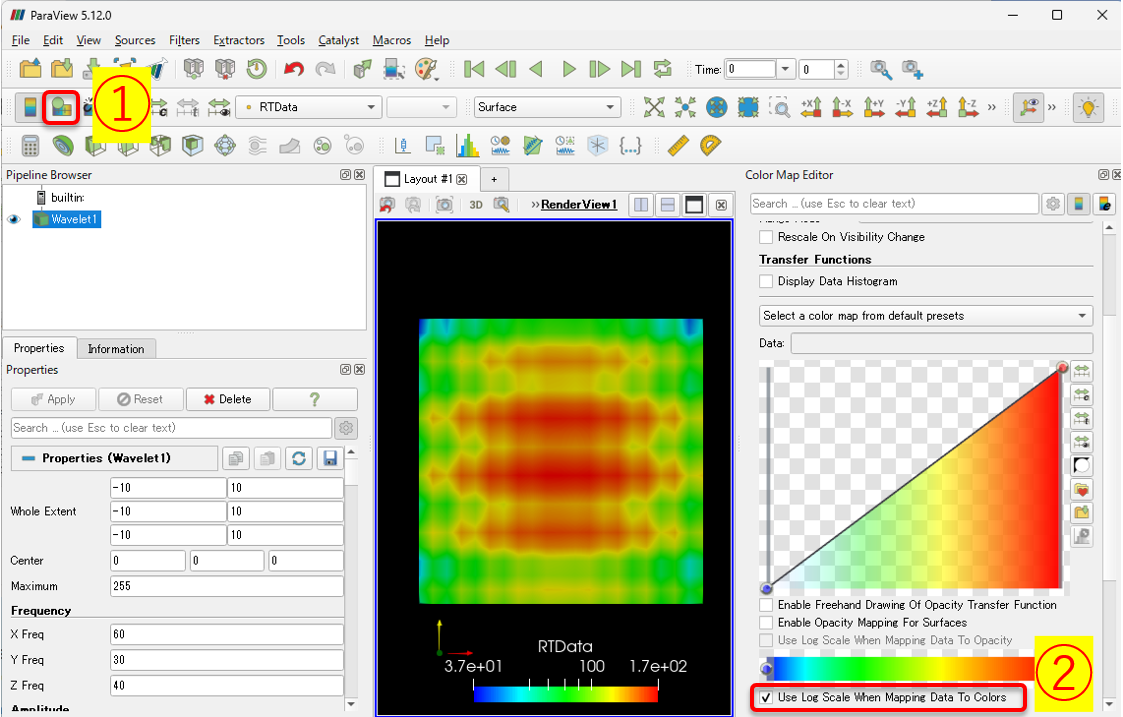
I am a beginner on paraview. I plot this diagram in paraview but my plot doesn’t seem like that. Below I attached a screenshot taken from a paper. I find out some lines on the legend. Can someone tell me what these lines indicates. How can I mark these lines in my plots. Maybe after that I will get the plot similar to that. Hope to hear from you soon. Thank you in advance.