Hi,
I’m using an Xdmf3 file to read in a three dimensional dataset in Paraview 4.4. There are three separate arrays that define the X, Y, and Z axes and a fourth three dimensional density dataset that I would like to render whose dimensions correlate to the X, Y, Z arrays.
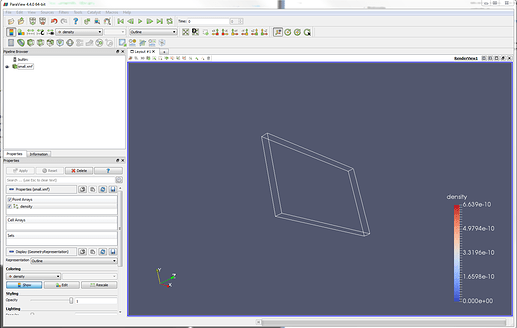
I’m able to read the arrays as a grid and the dataset as a point array from the .xmf file. Paraview recognizes the density data and generates a colormap for it, but the RenderView only displays the outline of the grid and not the density data.
Is there a certain setting that needs to be included to visualize the density dataset? Below is a screenshot of what I’m seeing and the xmf file that I’m using.
 <?xml version="1.0" ?>
 <!DOCTYPE Xdmf SYSTEM "Xdmf.dtd" []>
 <Xdmf Version="3.0">
   <Domain Name="test_geom">
     <Grid Name="SpatialCollection" GridType="Collection" CollectionType="Spatial">
       <Grid Name="position_grid" Type="Uniform">
         <Topology TopologyType="3DRectMesh" NumberOfElements="192 108 11">
         </Topology>
         <Geometry GeometryType="VXVYVZ">
           <DataItem Name="X" Format="HDF" NumberType="Float" Precision="8" Dimensions="192">
                       small-zplane.h5:/configuration/grid/small-halfday/xposition
           </DataItem>
           <DataItem Name="Y" Format="HDF" NumberType="Float" Precision="8" Dimensions="108">
                       small-zplane.h5:/configuration/grid/small-halfday/yposition
           </DataItem>
           <DataItem Name="Z" Format="HDF" NumberType="Float" Precision="8" Dimensions="11">
                       small-zplane.h5:/configuration/grid/small-halfday/zposition
           </DataItem>
         </Geometry>
         <Attribute Name="density" AttributeType="Scalar" Center="Node">
           <DataItem Dimensions="192 108 11" NumberType="Float" Precision="8" Format="HDF">
                       small-zplane.h5:/runs/self/output/density_3D
           </DataItem>
         </Attribute>
       </Grid>
     </Grid>
   </Domain>
 </Xdmf>
Thanks,
Scott
