I have a .vtu file with 100 scalar datasets. I want to go through them all
by using up and down arrows in the dropdown menu below “Colouring”.
However, at the moment that doesn’t work because the datasets have different ranges.
I would like to apply “Rescale to Data Range” automatically as I switch between the stata sets.
Can that be done?
Petr,
What you are describing should be ParaView’s default behavior. That is, when you change from Solid Color to a scalar dataset (data array), the object should be colored by that data array and the data range should be determined automatically for mapping data values to colors. Could you describe instead what you are seeing when you switch from one data array to another?
I am seeing the range of the data used to set up the color map staying constant as I switch from dataset to dataset.
Which version of ParaView are you using and on what OS? Would it be possible to share a dataset? Testing locally here I cannot produce the behavior you are seeing.
5.11.0 on Win 11.
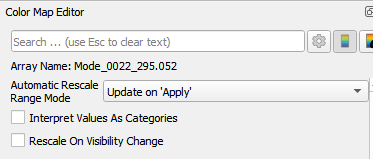
Does this have anything to do with it?

It seems likely - did you save a custom default color legend using the button highlighted in red which is at the bottom of the Color Map Editor?
If so, the “Update on ‘Apply’” property value for the Automatic Rescale Range Mode would be set on every new color legend.
However, when I tried to do that, every time I switch to a new data array, the color legend range is set to the full range of the data array, which is different from what you are reporting.
One thing to try, if you are willing to sacrifice any special ParaView settings you have, is to select
Edit menu → Reset to Default Settings
and restart ParaView. With the default settings the color legends should definitely be initialized to the full range of the data. if not, something else is going on here that I do not understand. In that case, posting an example dataset that I could try would be helpful.
I did this [click on save colormap as default for all] and the data sets are now properly scaled when selected. Thanks!
Hello @cory.quammen
This issue is quite frustrating, I had to reinstall the paraview to the latest version 6.0.0 on ubuntu, as the ‘reset to default settings’ didn’t work for me in version 5.11
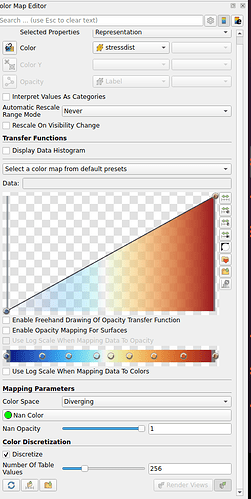
But even after reinstalling to the brand new version, still I am facing the same issue, the data rescales automatically although I changed the automatic rescale range mode to ‘Never’ in the color map editor.
The options at the bottom most are quite confusing, as there are no apply and Save, so not sure what is happening there.
@PetrKryslUCSD
May I know where is this option ‘colormap as default for all’, I wasn’t able to find in Edit–>Settings → General?
Please note the property I am trying to visualize on the render views has the same names.
Thanks!
Naresh
I found it, how to unlink the color map from 3. Color maps and transfer functions — ParaView Documentation 5.12.0 documentation.
Thanks


