I am trying to add a CI/CD testing to my code that aims to run ParaView+Catalyst to create some simple visualization etc. through use of GitHub runners. I could able to install everything using spack package manager with both osmesa and egl support under ubuntu-24.04 . The test is running fine if I use catalyst_grid_writer.py and dump the data through the Catalyst and the data are also looking good when I checked the artifacts. The issue is the actual rendering. In both cases (egl and osmesa) the visualization pipeline is creating garbage output (all black rendering or some weird shapes in result PNG file - no error in the logs etc). The same visualization pipeline is working fine if I run the same case in a HPC environment with egl support. So, I think that there is something missing in terms of egl or osmesa library or ParaView installation since the only issue is rendering and code connects to the ParaView Catalyst without any issue and dump data. At this point I wonder if anyone tried this before. Any suggestion about the Ubuntu version, installed package are welcome. As a reference, I am also adding some information about the runner environment,
Can you get ParaView to dump its available graphics information? It’s not in 5.13, but the Python code in this MR may prove helpful to get what you need.
@ben.boeckel@mwestphal Thanks both for your help. Here are some output from HPC machine vs GitHub runner about PV information,
HPC Machine with EGL:
ParaView Version           5.13.1
VTK Version                9.3.20240617
Python Library Path        /glade/work/epicufsrt/contrib/spack-stack/derecho/spack-stack-1.9.1/envs/ue-oneapi-2024.2.1/install/oneapi/2024.2.1/python-3.11.7-ynglhq2/lib/python3.11
Python Library Version     3.11.7 (main, Mar  7 2025, 11:40:34) [Clang 19.0.0 (icx 2024.2.1.20240711)]
Python Numpy Support       True
Python Numpy Version       1.26.4
Python Matplotlib Support  True
Python Matplotlib Version  3.7.4
MPI Enabled                True
--MPI Rank/Size            0/1
Disable Registry           False
SMP Backend                Sequential
SMP Max Number of Threads  1
OpenGL Vendor              NVIDIA Corporation
OpenGL Version             4.6.0 NVIDIA 560.35.03
OpenGL Renderer            NVIDIA A100 80GB PCIe/PCIe/SSE2
GitHub Runner OSMesa:
ParaView Version           5.13.2
VTK Version                9.3.20240617
Python Library Path        /home/runner/work/GeoGate/GeoGate/app/spack/opt/spack/linux-x86_64/python-3.11.11-yic3u2kjrbkbcdzpdc77fb7g2skle5hf/lib/python3.11
Python Library Version     3.11.11 (main, Apr 17 2025, 19:46:55) [GCC 14.2.0]
Python Numpy Support       True
Python Numpy Version       1.25.2
Python Matplotlib Support  True
Python Matplotlib Version  3.10.0
MPI Enabled                True
--MPI Rank/Size            0/1
Disable Registry           False
SMP Backend                Sequential
SMP Max Number of Threads  1
OpenGL Vendor              Mesa
OpenGL Version             4.5 (Core Profile) Mesa 23.3.6
OpenGL Renderer            llvmpipe (LLVM 18.1.3, 256 bits)
GitHub Runner EGL:
ParaView Version           5.13.2
VTK Version                9.3.20240617
Python Library Path        /home/runner/work/GeoGate/GeoGate/app/spack/opt/spack/linux-x86_64/python-3.11.11-yic3u2kjrbkbcdzpdc77fb7g2skle5hf/lib/python3.11
Python Library Version     3.11.11 (main, Apr 17 2025, 19:50:07) [GCC 14.2.0]
Python Numpy Support       True
Python Numpy Version       1.25.2
Python Matplotlib Support  True
Python Matplotlib Version  3.10.0
MPI Enabled                True
--MPI Rank/Size            0/1
Disable Registry           False
SMP Backend                Sequential
SMP Max Number of Threads  1
OpenGL Vendor              Mesa
OpenGL Version             4.5 (Compatibility Profile) Mesa 24.2.8-1ubuntu1~24.04.1
OpenGL Renderer            llvmpipe (LLVM 19.1.1, 256 bits)
In runner one, both EGL and OSMesa installations show same OpenGL vendor. I am not sure it is expected. @mwestphal I also run the simple script that create green sphere with pvpython and it works fine and render correctly in both case (egl and osmesa as backend). I could also try to create similar simple case and export as a Catalyst script and try to run see what happens. Do you want me to do it?
@mwestphal Okay. I also created a green sphere with ParaView and export it as a Catalyst script and run it in parallel (6-cores). I could also render green sphere successfully. So, maybe there is an issue with parallelization. In my case, the data flowing from the simulation code is in vtkPartitionedDataSet form. It is working fine on HPC machine with variety different cases and configurations (and number of processors). So, having bug in the catalyst adaptor of the simulation is very minimal. Also when I try to dump data with catalyst rather then rendering it works fine (I also check it with PV). BTW, I am not defining multi-domain attribute in catalyst adaptor but I could add and try with it if it helps but again the code is working fine on HPC platform. Let me know if you have any idea? Thanks again for your help.
Yes. The data looks fine. But, as you already know that each process writes its own data with the catalyst writer scripts (see example list of files for one time snapshot),
So, there is no any data processing that requires access to each sub-domain and render it. In case of rendering the multi-block data might have some issue in this case. Maybe I could create another simple programmable source like green sphere but create different blocks for each processor and try to render it. If there is an issue with parallelization and rendering, it mush show the same issue. Anyway, not sure at this point.
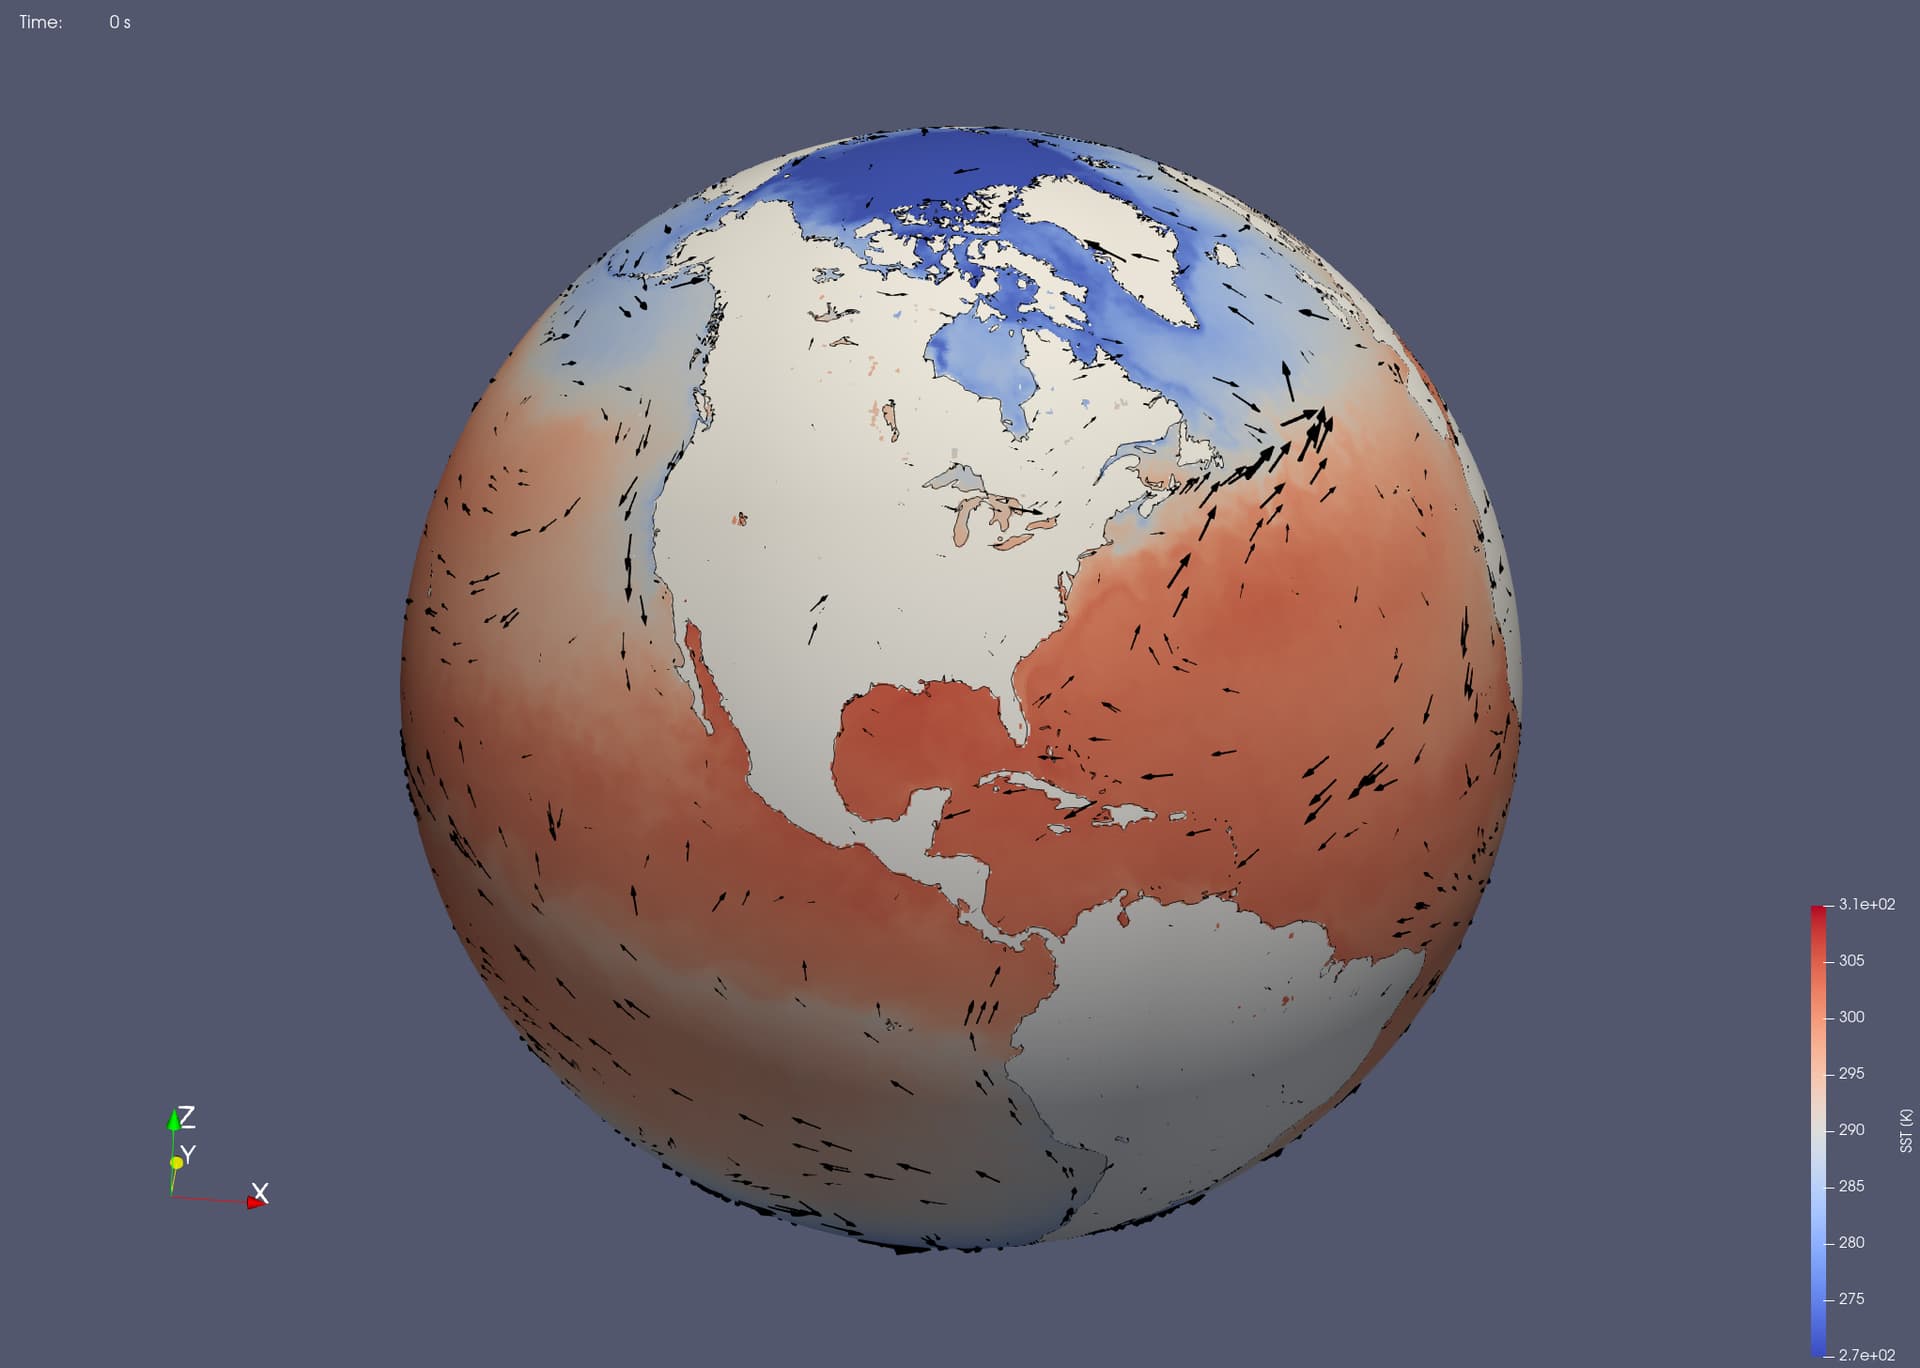
@mwestphal@ben.boeckel Just to update, it seems that the issue is related with the vector plotting. I am not sure what is going on at this point but I could able to create simple rendering with sea surface temperature data only with original configuration using Catalyst. Then, I tried vector plotting by changing,
from
glyph1.GlyphMode = 'Uniform Spatial Distribution (Surface Sampling)'
glyph1.MaximumNumberOfSamplePoints = 10000
to
glyph1.GlyphMode = 'Uniform Spatial Distribution (Bounds Based)'
glyph1.MaximumNumberOfSamplePoints = 5000
and works fine. It could create following with OSMesa,
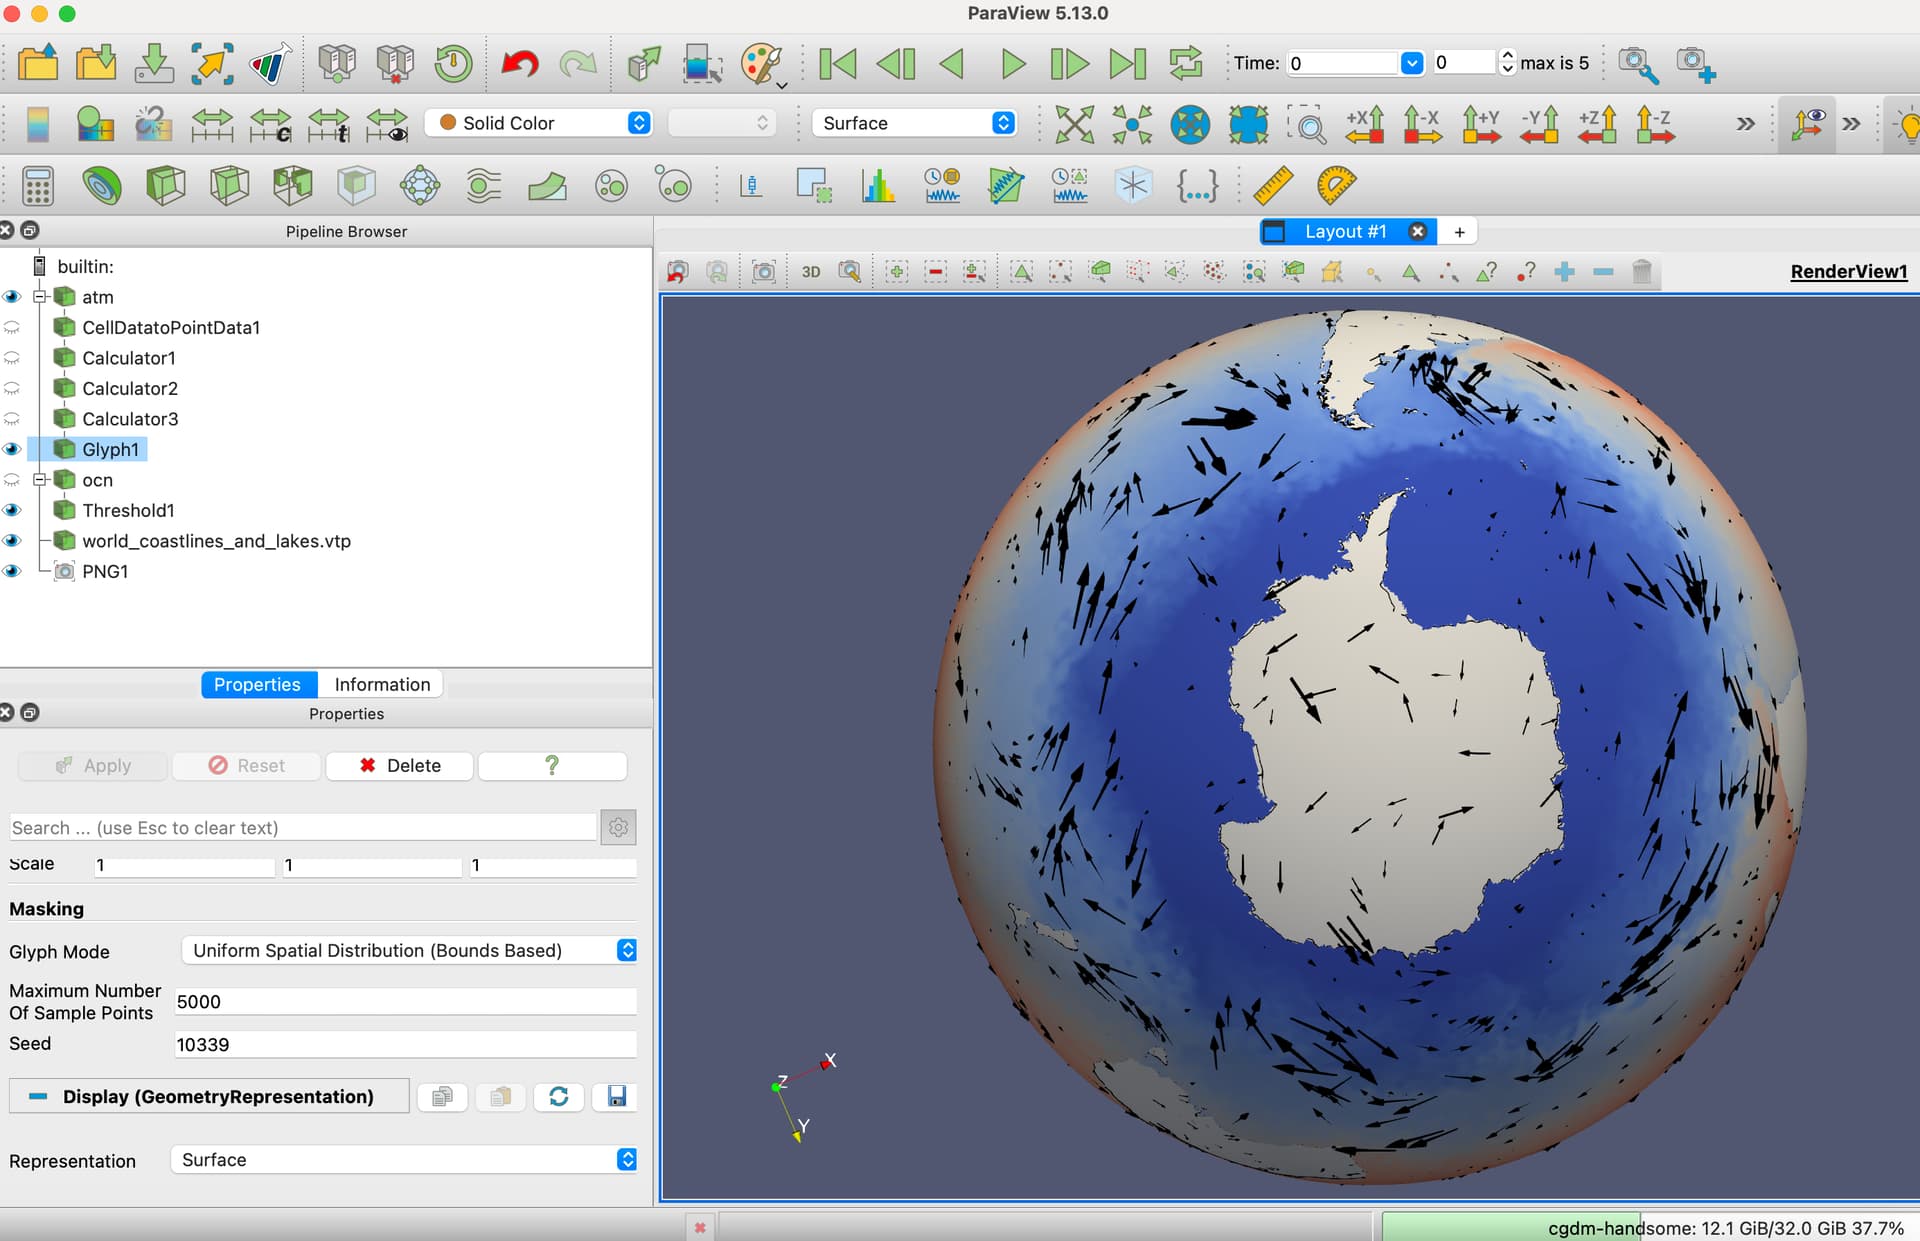
EGL one still shows some issue with the vectors for some time steps and seems that the black plots that I see in the past was very large Glyphs. I am not sure why PV is creating those artifacts but maybe the original one was creating more pressure in the memory and producing garbage vector output. The workflow looks like following,
The calculators in the atm source is mapping vectors from lat-lon grid to cartesian. Anyway, let me know if you want to debug this in your end. I could provide both data files and PV state file. BTW, thanks both of you for your help.
@mwestphal JFYI, I found more time to debug the issue at the weekend. It seems that the data files used by the model configuration had some issue. I was packing files using NCO operator to reduce the file size of the inputs in the action and the data component was misinterpreting the data along with the fill value in the netcdf file. If I use original data without packing and fixing fill values, the data look fine and has no any large values and everything are in the expected range. I think there is no any issue in Catalyst or ParaView side. Anyway, thanks again for your help. Best,