I am new to this forum, so please be patient if I do not pose my question in the correct format.
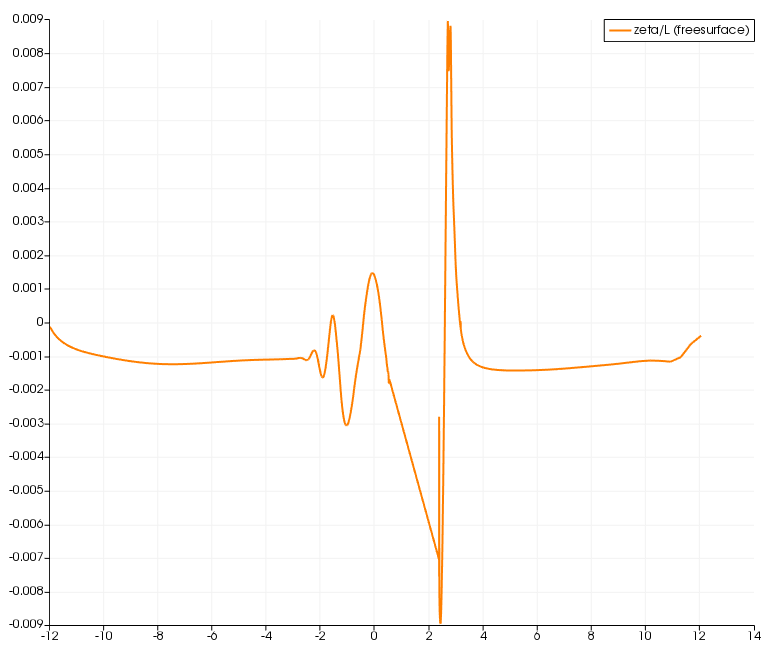
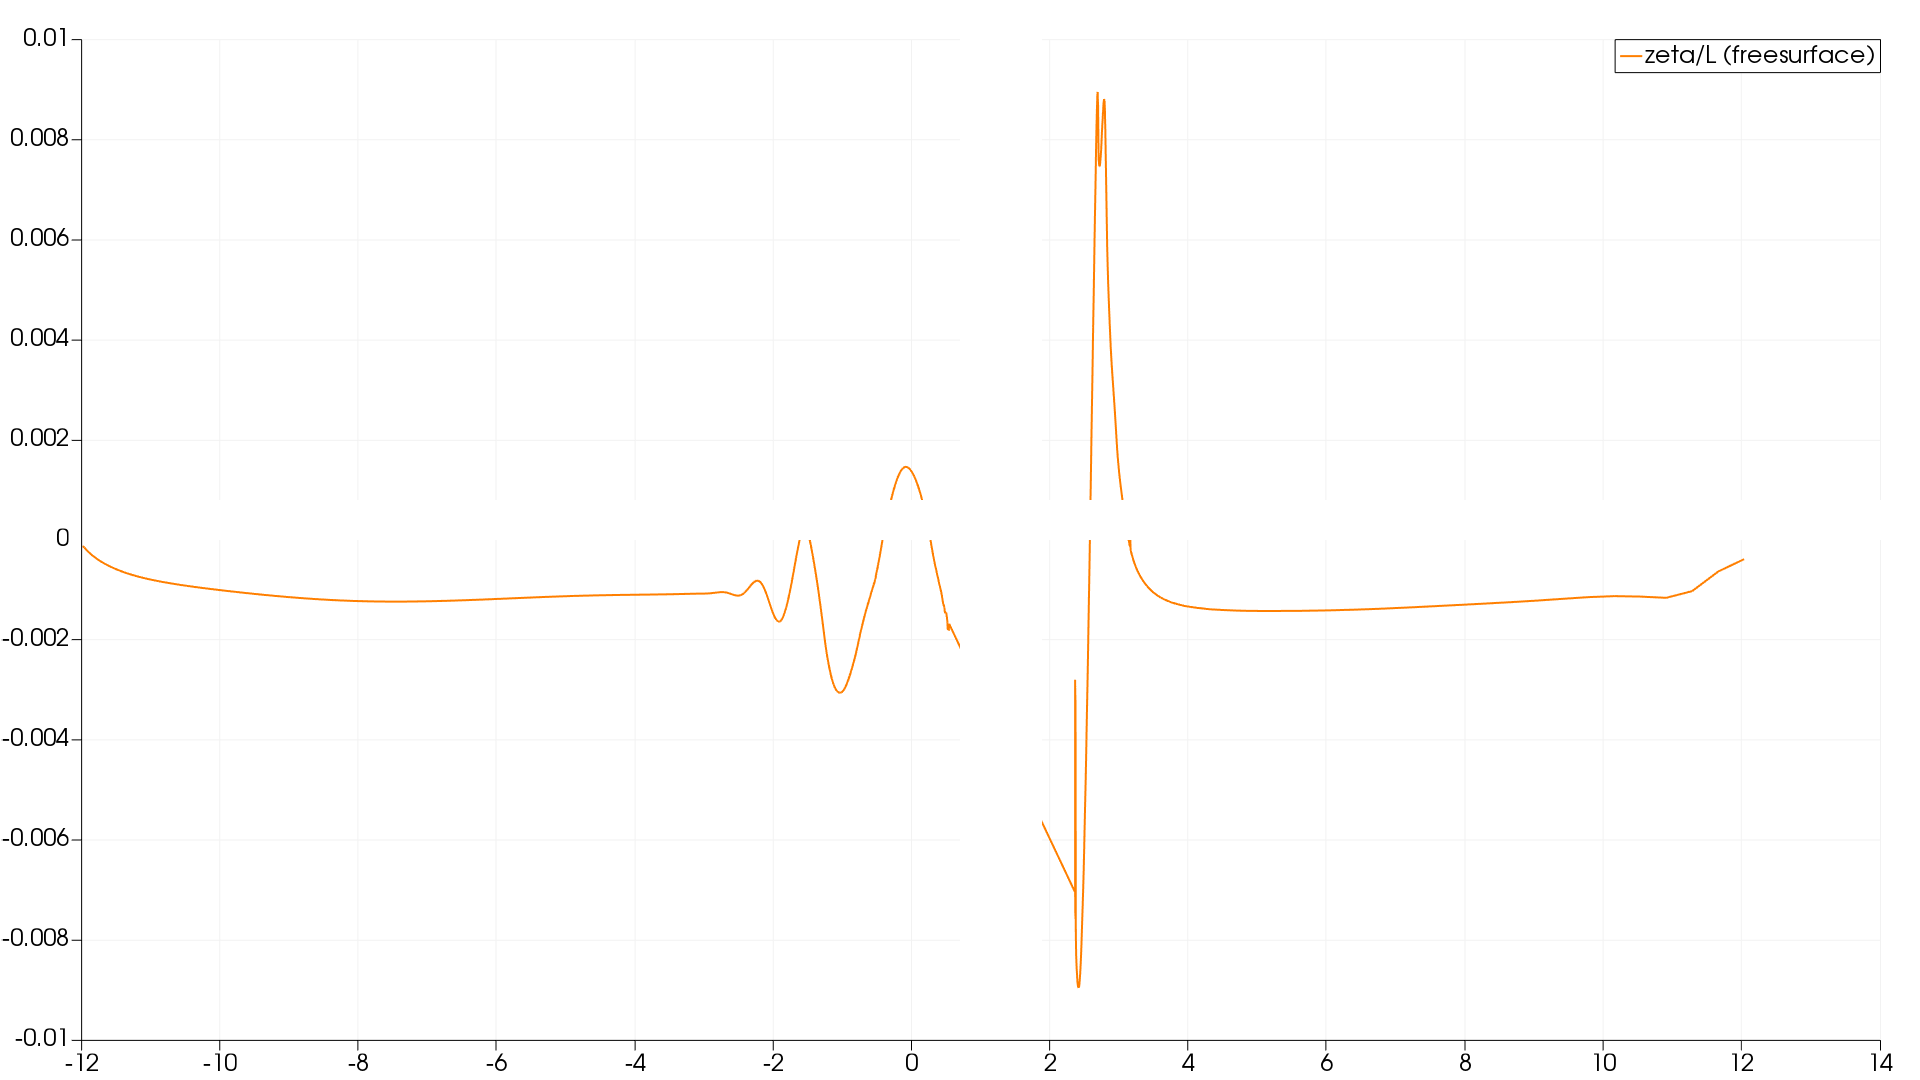
I am using Paraview 5.5.2 Qt5 64 bit on Windows 7 with python scripting and have an issue with SaveScreenshot when I select a output resolution other than the one that is used when I save my actions using the python trace. With the settings as provided by the trace [774x652] I get a nice plot of my PlotData filter in the LineChartView, but I would like to have a higher resolution plot. Therefore, I changed the output resolution to 1920x1080, and get a plot with blank bands in the graph. Does anybody know what I am doing wrong?
Thanks for your reaction. I have figured out how to attach files, so here are the original (mwe_screenshot-ori.png, first figure) and the high resolution screenshots (mwe_screenshot-hires.png, second figure). As tou can see, about halfway horizontally and vertically, there is a white bar where the line should be. Hope this helps.