Hello,
When I am plotting nc_ scalar field in this folder Dropbox - 21 - Simplify your life I see that the values on the plot are changing in the range from 1 to 0.97, with most of the plot at the minimal value 0.97. However, this part of the plot should actually have a range of values from 0.97 to 0.0. Is there anything with the Paraview settings I should change? Thank you!
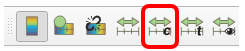
You can set the appropriate minimum and maximum value range yourself via the Rescale To Custom Data Range icon.
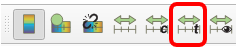
Or you can also use the Rescale Range Over Times icon to specify minimum and maximum values over all time steps.