bergt
September 29, 2020, 1:30pm
1
Hi,
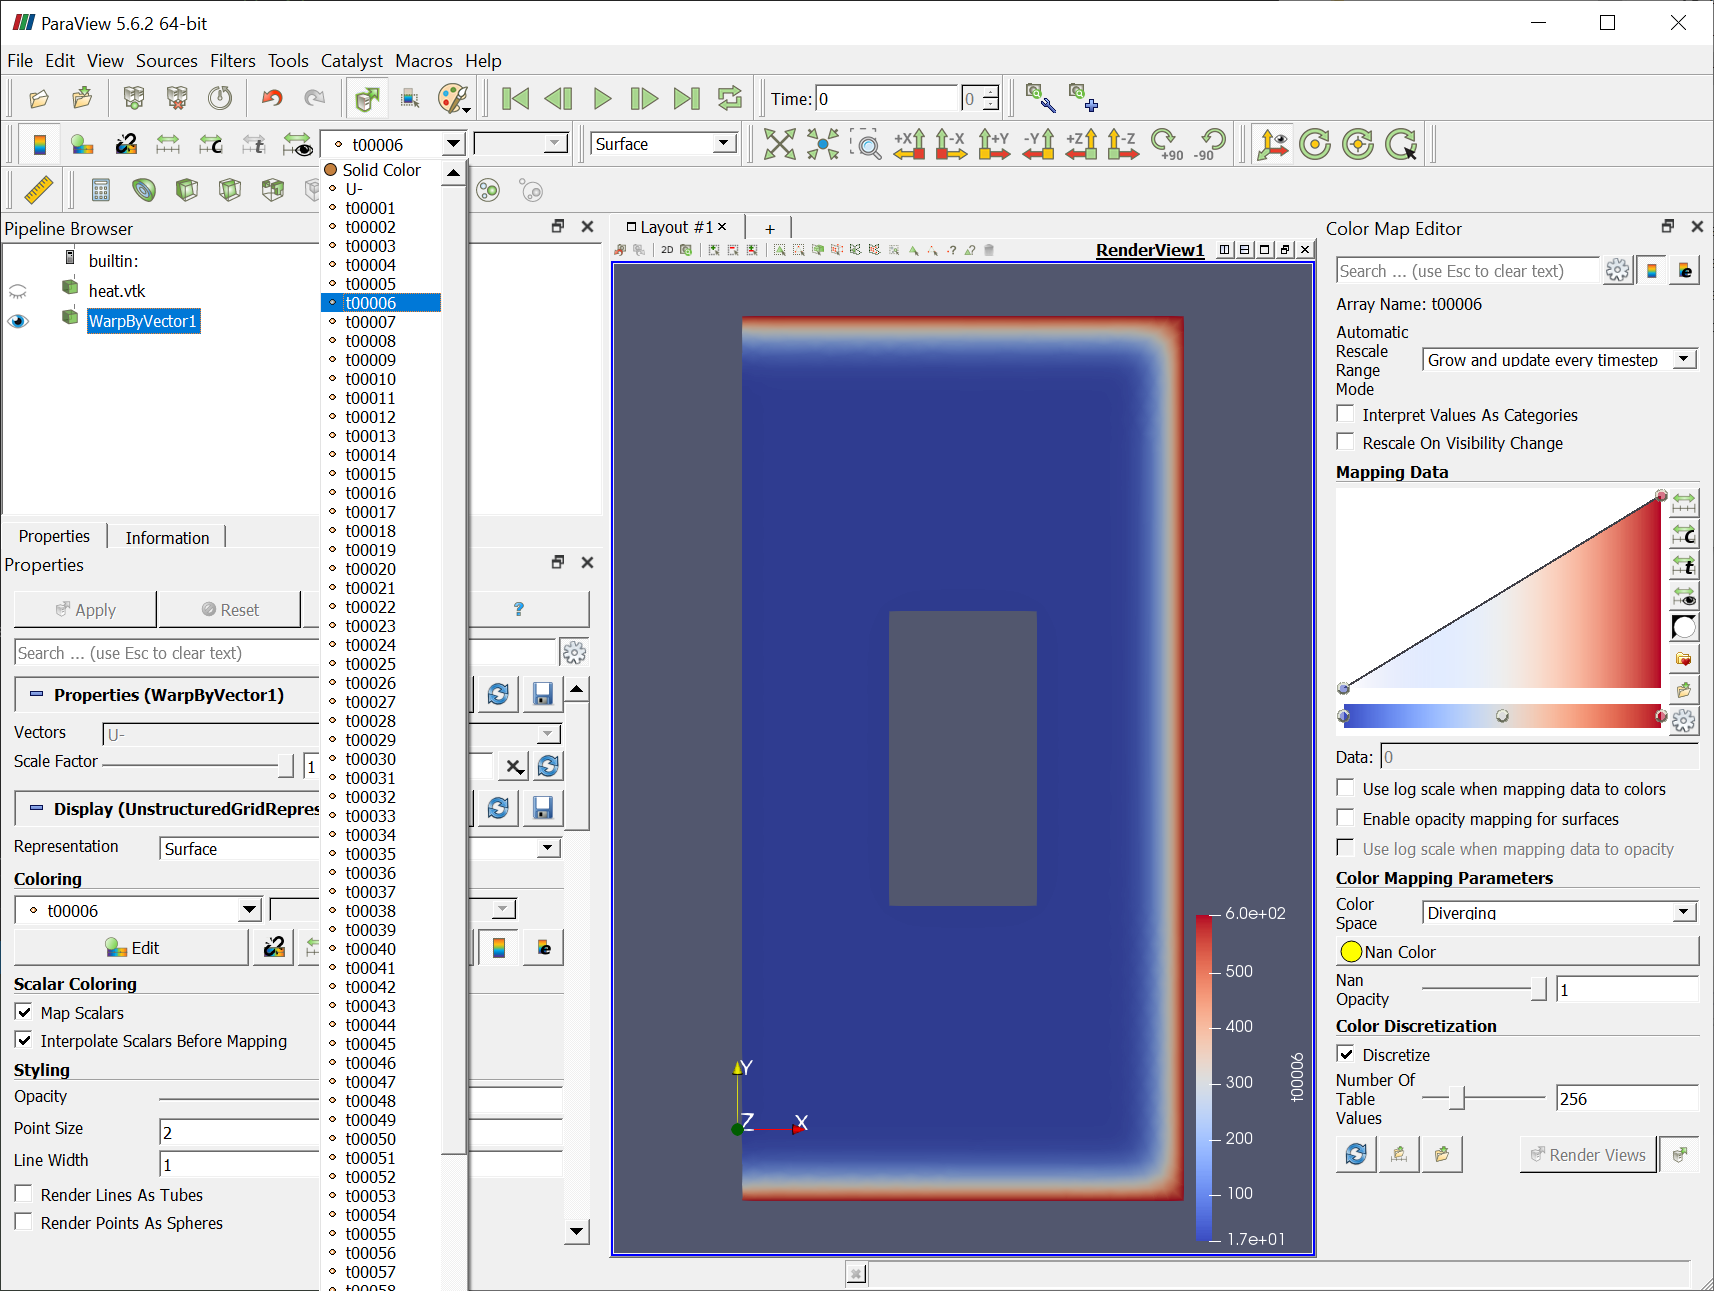
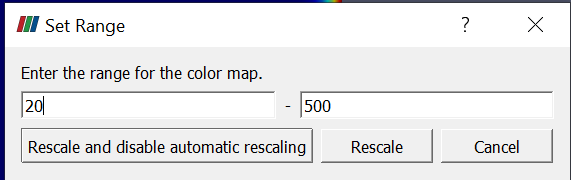
My problem is that I have a lot of outputs (actually a set of outputs (time serie)) and I want to know if there is a easy way to set the limits and style to the legend for all outputs at once?
I know how to do it per output but it takes forever to do that and if I close the program an re-opens it all settings are gone
I attach my vtk-file.
heat.vtk (3.3 MB)
Hoping for a helpful advise
Best regards
mwestphal
September 29, 2020, 2:23pm
2
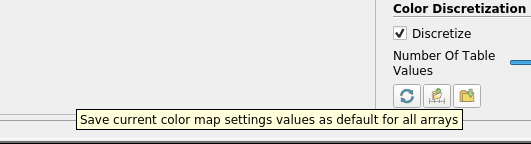
Use the SaveSettings button below.
bergt
September 29, 2020, 5:03pm
3
Thank you!
Den tis 29 sep. 2020 16:23Mathieu Westphal (Kitware) via ParaView <noreply@discourse.paraview.org > skrev:
bergt
September 30, 2020, 4:51am
4
Hi @mwestphal
Best regards
mwestphal
September 30, 2020, 8:25am
5
Afaik, this is not supported. I’d suggest transforming your file into a time series instead.
bergt
September 30, 2020, 8:52am
6
I have thought about that… are there any examples on how to do that?
mwestphal
September 30, 2020, 9:20am
7
I’d write a python script for that. Add a calculator, then something like:
for (i in range(120)):
  str = "{:05d}".format(i)
  calculator.Function = "t"+ str
  UpdatePipeline()
  SaveData("/home/glow/data/tmp/aka/heat" + str + ".vtu')
This was not tested though.
bergt
September 30, 2020, 9:34am
8
Thanx! I’ll try that!