hello all,
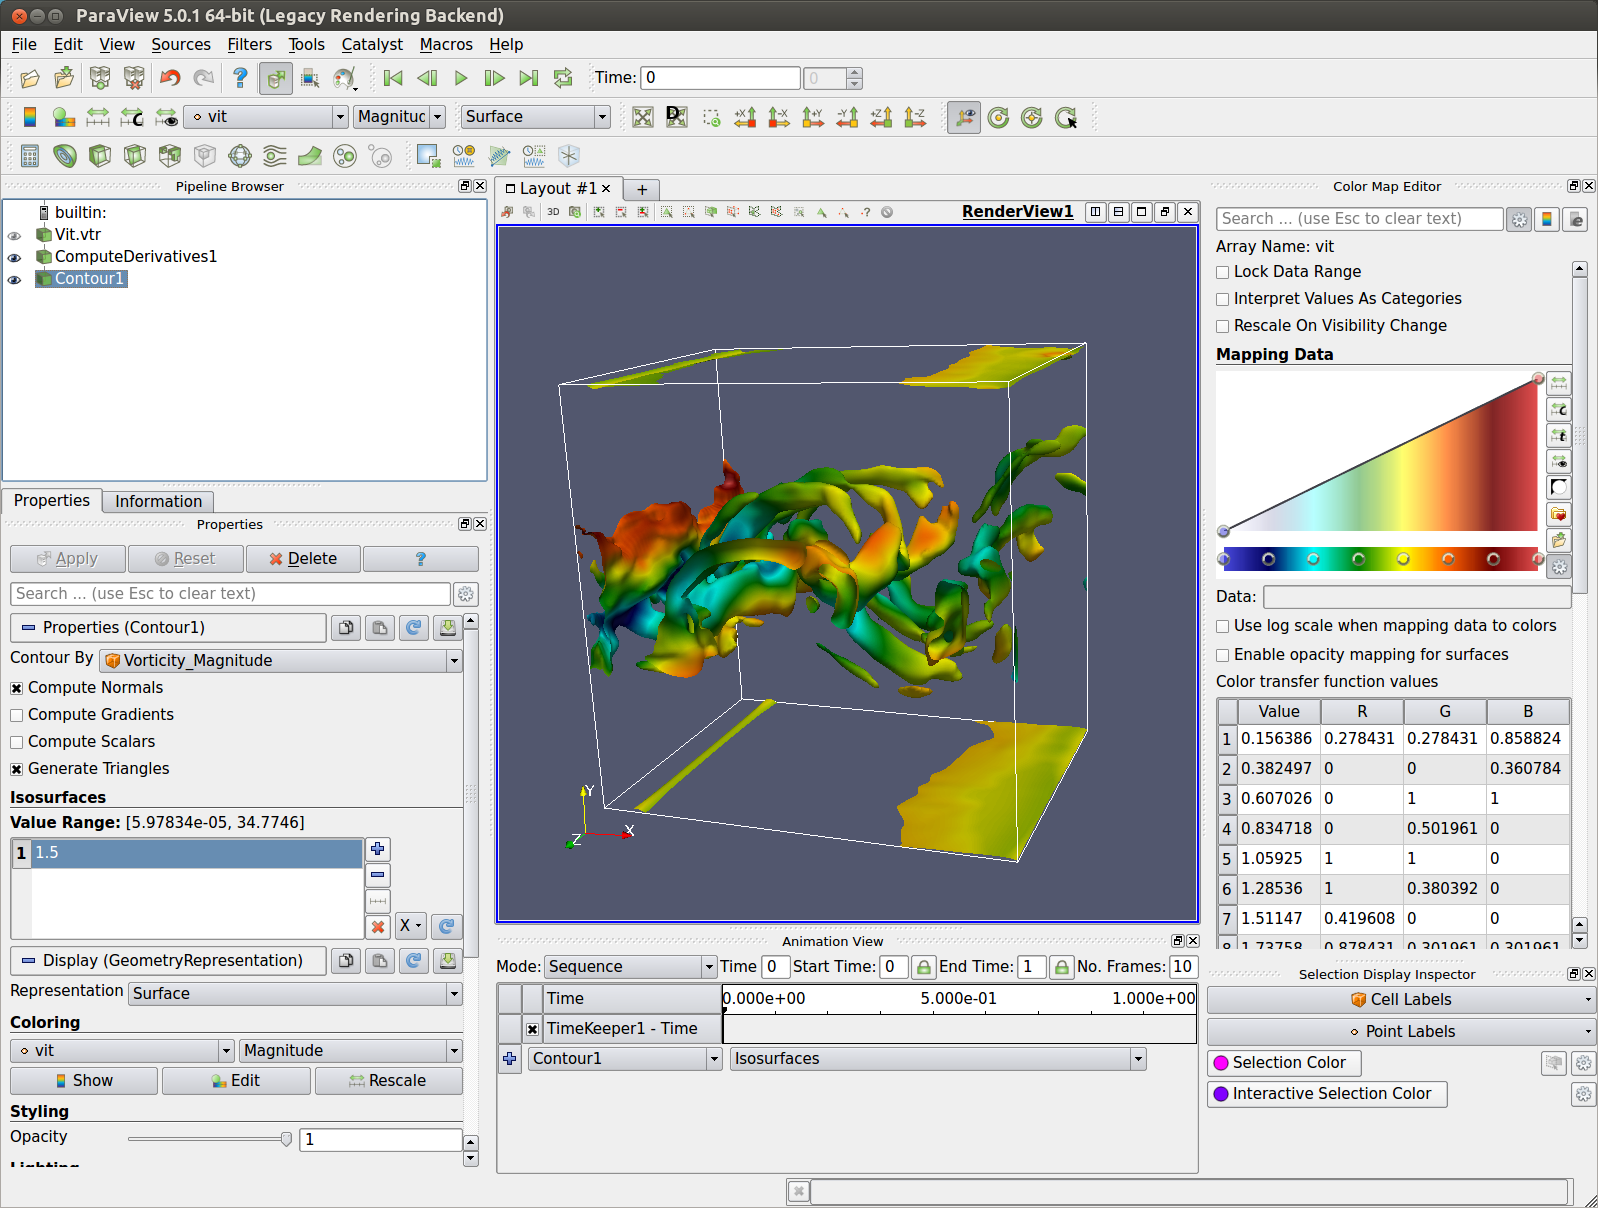
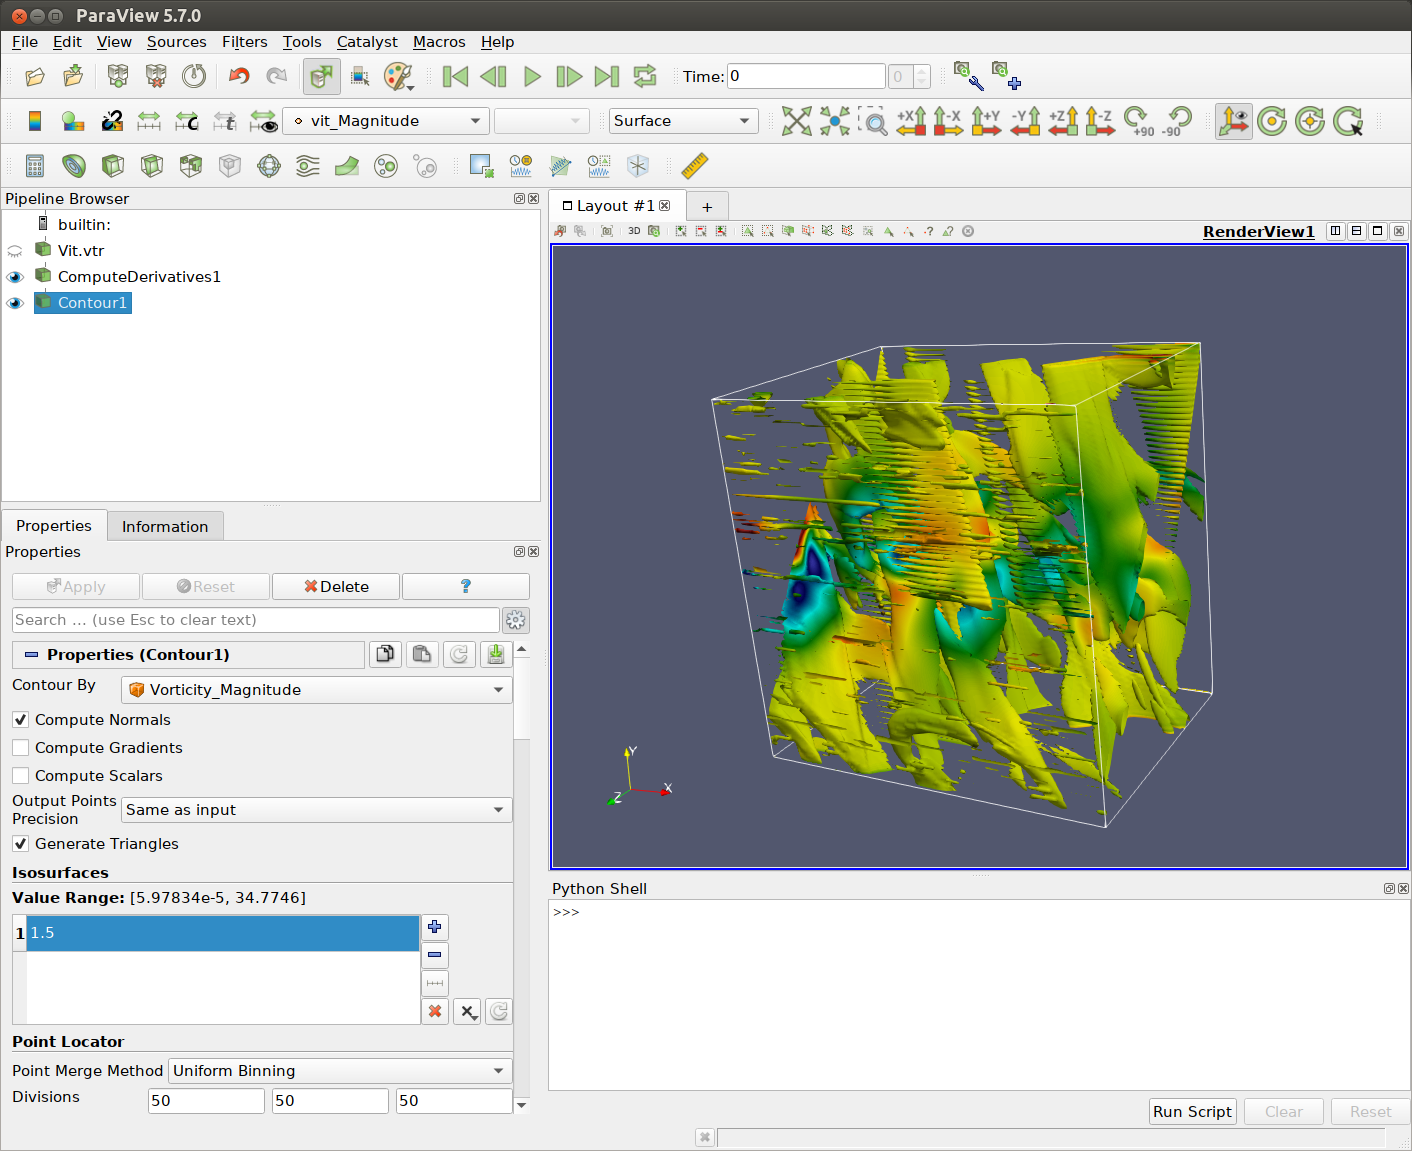
just to say I think there is a bug when showing vorticity with paraview 5.7 (https://www.paraview.org/paraview-downloads/download.php?submit=Download&version=v5.7&type=binary&os=Linux&downloadFile=ParaView-5.7.0-MPI-Linux-Python3.7-64bit.tar.gz)
You can avoid it with pvbatch, by changing [CELLS] to [POINTS] :slight_smile, like this :
 # create a new 'Compute Derivatives'
  computeDerivatives1 = ComputeDerivatives(Input=vitvtr)
  computeDerivatives1.Scalars = ['POINTS', 'vit_Magnitude']
  computeDerivatives1.Vectors = ['POINTS', 'vit']
  computeDerivatives1.OutputVectorType = 'Vorticity'

# create a new 'Contour'
  contour1 = Contour(Input=transform2)
  #contour1.ContourBy = ['CELLS', 'Vorticity_Magnitude']
  **contour1.ContourBy = ['POINTS', 'Vorticity_Magnitude']**
  contour1.Isosurfaces = [1.5]
  contour1.PointMergeMethod = 'Uniform Binning'

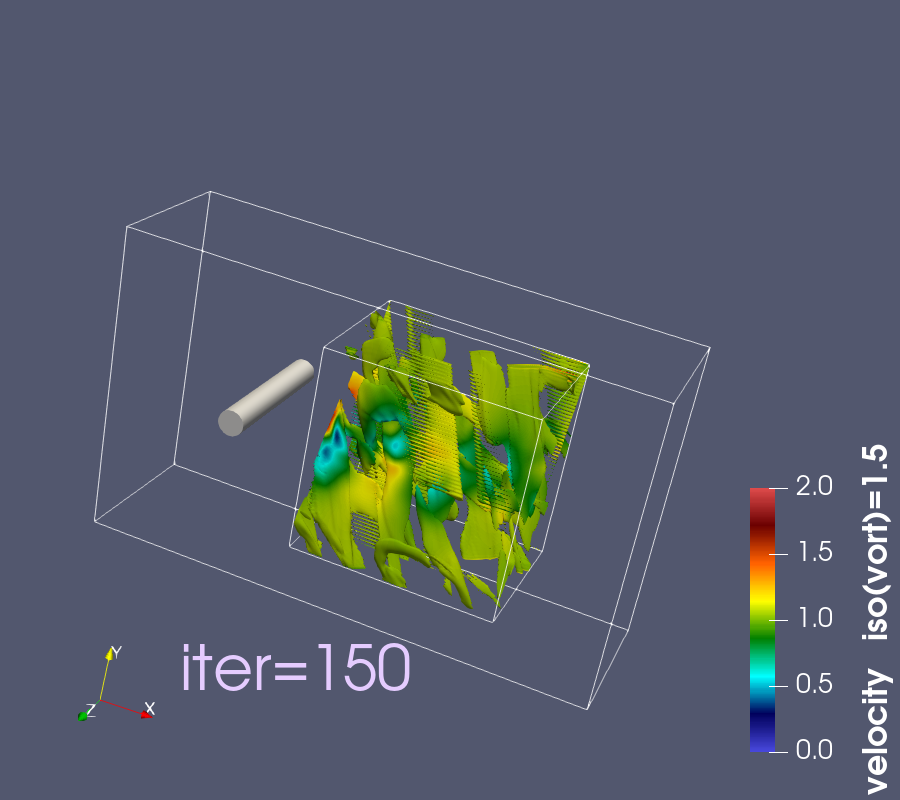
OR you can calculated vorticity like in older release, by defining the gradient (see below).
I hope it can help someone
Code Example
Vort_calculated_by_paraview.py (12.7 KB)
# state file generated using paraview version 5.7.0

# ----------------------------------------------------------------
# setup views used in the visualization
# ----------------------------------------------------------------

# trace generated using paraview version 5.7.0
#
# To ensure correct image size when batch processing, please search
# for and uncomment the line `# renderView*.ViewSize = [*,*]`

#### import the simple module from the paraview
from paraview.simple import *
#### disable automatic camera reset on 'Show'
paraview.simple._DisableFirstRenderCameraReset()

# get the material library
materialLibrary1 = GetMaterialLibrary()

# Create a new 'Render View'
renderView1 = CreateView('RenderView')
renderView1.ViewSize = [1500, 850]
renderView1.AxesGrid = 'GridAxes3DActor'
renderView1.CenterOfRotation = [5.0, 6.0, 3] # centre du cylindre
renderView1.StereoType = 'Crystal Eyes'
renderView1.CameraPosition = [25, 30, 50] # vers l'aval
renderView1.CameraFocalPoint = [10, 5, -4] # derrière le volume
#renderView1.CameraViewUp = [-0.25, 0.95, -0.23] # vue un peu de dessus
renderView1.CameraViewUp = [-0.3, 0.9, -0.3] # vue un peu de dessus
renderView1.CameraFocalDisk = 1.0
renderView1.CameraParallelScale = 1.2
renderView1.Background = [0.32, 0.34, 0.43]
renderView1.BackEnd = 'OSPRay raycaster'
renderView1.OSPRayMaterialLibrary = materialLibrary1

SetActiveView(None)

# ----------------------------------------------------------------
# setup view layouts
# ----------------------------------------------------------------

# create new layout object 'Layout #1'
layout1 = CreateLayout(name='Layout #1')
layout1.AssignView(0, renderView1)

# ----------------------------------------------------------------
# restore active view
SetActiveView(renderView1)
# ----------------------------------------------------------------

# ----------------------------------------------------------------
# setup the data processing pipelines
# ----------------------------------------------------------------

# create a new 'Text'
text1 = Text()
text1.Text = 'iter=150'

# create a new 'Cylinder'
cylinder1 = Cylinder()
cylinder1.Resolution = 25
cylinder1.Height = 6.0
cylinder1.Radius = 0.5

# create a new 'Box'
box1 = Box()
box1.XLength = 20.0
box1.YLength = 12.0
box1.ZLength = 6.0
box1.Center = [10.0, 6.0, 3.0]

# create a new 'Transform'
transform1 = Transform(Input=cylinder1)
transform1.Transform = 'Transform'

# init the 'Transform' selected for 'Transform'
transform1.Transform.Translate = [5.0, 6.0, 3.0]
transform1.Transform.Rotate = [90.0, 0.0, 0.0]

# create a new 'XML Rectilinear Grid Reader'
vitvtr = XMLRectilinearGridReader(FileName=[Vit.vtr'])
#vitvtr.PointArrayStatus = ['vit', 'vit_norm']
vitvtr.PointArrayStatus = ['vit']

### VORTICITY colored by VELOCITY ###
code_vort = 2

############### CONTOUR by [computeDerivatives = vorticiy] -> ERROR : [POINT] not [CELLS] ##############
if code_vort == 1:

  # create a new 'Compute Derivatives'
  computeDerivatives1 = ComputeDerivatives(Input=vitvtr)
  computeDerivatives1.Scalars = ['POINTS', 'vit_Magnitude']
  computeDerivatives1.Vectors = ['POINTS', 'vit']
  computeDerivatives1.OutputVectorType = 'Vorticity'

  # create a new 'Transform'
  transform2 = Transform(Input=computeDerivatives1)
  transform2.Transform = 'Transform'

  # init the 'Transform' selected for 'Transform'
  transform2.Transform.Translate = [8.0, 2.0, 0.0]

  # create a new 'Contour'
  contour1 = Contour(Input=transform2)
  #contour1.ContourBy = ['CELLS', 'Vorticity_Magnitude']
  contour1.ContourBy = ['POINTS', 'Vorticity_Magnitude']
  contour1.Isosurfaces = [1.5]
  contour1.PointMergeMethod = 'Uniform Binning'

############### CONTOUR by [computeDerivatives = gradient] ##############
else:

  # create a new 'Compute Derivatives'
  computeDerivatives1 = ComputeDerivatives(Input=vitvtr)
  computeDerivatives1.Scalars = ['POINTS', 'vit_Magnitude']
  computeDerivatives1.Vectors = ['POINTS', 'vit']
  computeDerivatives1.OutputVectorType = 'Scalar Gradient'

  # create a new 'Transform'
  transform2 = Transform(Input=computeDerivatives1)
  transform2.Transform = 'Transform'

  # init the 'Transform' selected for 'Transform'
  transform2.Transform.Translate = [8.0, 2.0, 0.0]

  # create a new 'Calculator'
  calculator1 = Calculator(Input=transform2)
  calculator1.AttributeType = 'Cell Data'
  calculator1.ResultArrayName = 'vort'
  calculator1.Function = '(VectorGradient_5-VectorGradient_7)*iHat+(VectorGradient_6-VectorGradient_2)*jHat+(VectorGradient_1-VectorGradient_3)*kHat'

  # create a new 'Cell Data to Point Data'
  cellDatatoPointData1 = CellDatatoPointData(Input=calculator1)
  #cellDatatoPointData1.CellDataArraytoprocess = ['vit', 'vit_Magnitude', 'ScalarGradient', 'VectorGradient', 'VectorGradient_Magnitude', 'vort']
  cellDatatoPointData1.CellDataArraytoprocess = ['vit', 'vit_Magnitude', 'vort', 'vort_Magnitude']

  # create a new 'Contour'
  contour1 = Contour(Input=cellDatatoPointData1)
  contour1.ContourBy = ['POINTS', 'vort_Magnitude']
  contour1.Isosurfaces = [1.5]
  contour1.PointMergeMethod = 'Uniform Binning'
…